
 Yahoo Finance
 Are Albany International Corp.'s (NYSE:AIN) Interest Costs Too High?

Want to participate in a short research study? Help shape the future of investing tools and you could win a $250 gift card!
Small-caps and large-caps are wildly popular among investors; however, mid-cap stocks, such as Albany International Corp. (NYSE:AIN) with a market-capitalization of US$2.6b, rarely draw their attention. While they are less talked about as an investment category, mid-cap risk-adjusted returns have generally been better than more commonly focused stocks that fall into the small- or large-cap categories. AIN’s financial liquidity and debt position will be analysed in this article, to get an idea of whether the company can fund opportunities for strategic growth and maintain strength through economic downturns. Note that this commentary is very high-level and solely focused on financial health, so I suggest you dig deeper yourself into AIN here.
View our latest analysis for Albany International
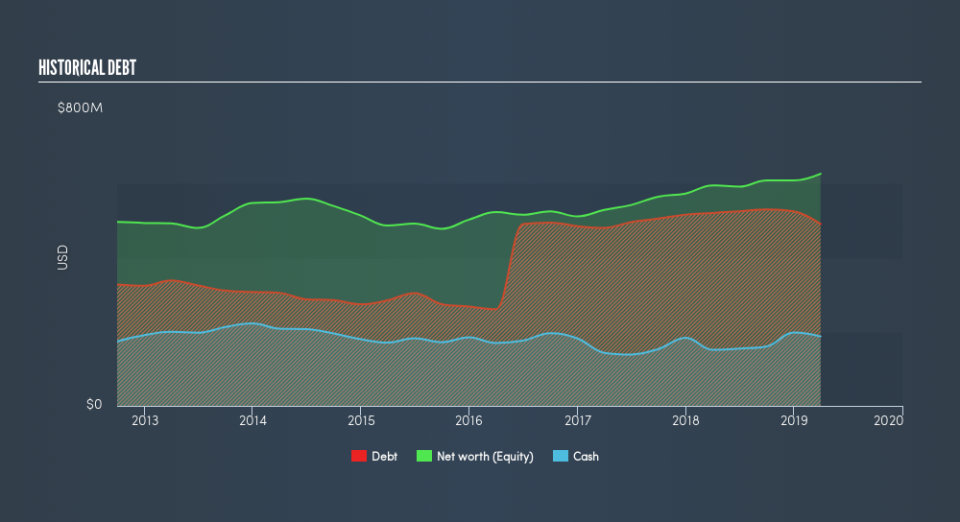
AIN’s Debt (And Cash Flows)
AIN has sustained its debt level by about US$524m over the last 12 months – this includes long-term debt. At this current level of debt, AIN's cash and short-term investments stands at US$187m , ready to be used for running the business. Moreover, AIN has produced cash from operations of US$176m over the same time period, leading to an operating cash to total debt ratio of 34%, indicating that AIN’s current level of operating cash is high enough to cover debt.
Can AIN meet its short-term obligations with the cash in hand?
At the current liabilities level of US$205m, it appears that the company has been able to meet these obligations given the level of current assets of US$612m, with a current ratio of 2.99x. The current ratio is calculated by dividing current assets by current liabilities. For Machinery companies, this ratio is within a sensible range since there's a sufficient cash cushion without leaving too much capital idle or in low-earning investments.
Is AIN’s debt level acceptable?
AIN is a relatively highly levered company with a debt-to-equity of 82%. This is not unusual for mid-caps as debt tends to be a cheaper and faster source of funding for some businesses. We can check to see whether AIN is able to meet its debt obligations by looking at the net interest coverage ratio. A company generating earnings before interest and tax (EBIT) at least three times its net interest payments is considered financially sound. In AIN's, case, the ratio of 9.02x suggests that interest is appropriately covered, which means that lenders may be less hesitant to lend out more funding as AIN’s high interest coverage is seen as responsible and safe practice.
Next Steps:
AIN’s high cash coverage means that, although its debt levels are high, the company is able to utilise its borrowings efficiently in order to generate cash flow. This may mean this is an optimal capital structure for the business, given that it is also meeting its short-term commitment. I admit this is a fairly basic analysis for AIN's financial health. Other important fundamentals need to be considered alongside. You should continue to research Albany International to get a more holistic view of the mid-cap by looking at:
Future Outlook: What are well-informed industry analysts predicting for AIN’s future growth? Take a look at our free research report of analyst consensus for AIN’s outlook.
Valuation: What is AIN worth today? Is the stock undervalued, even when its growth outlook is factored into its intrinsic value? The intrinsic value infographic in our free research report helps visualize whether AIN is currently mispriced by the market.
Other High-Performing Stocks: Are there other stocks that provide better prospects with proven track records? Explore our free list of these great stocks here.
We aim to bring you long-term focused research analysis driven by fundamental data. Note that our analysis may not factor in the latest price-sensitive company announcements or qualitative material.
If you spot an error that warrants correction, please contact the editor at editorial-team@simplywallst.com. This article by Simply Wall St is general in nature. It does not constitute a recommendation to buy or sell any stock, and does not take account of your objectives, or your financial situation. Simply Wall St has no position in the stocks mentioned. Thank you for reading.
