
 Yahoo Finance
 Is Allegheny Technologies Incorporated (NYSE:ATI) A Financially Sound Company?

Small-caps and large-caps are wildly popular among investors; however, mid-cap stocks, such as Allegheny Technologies Incorporated (NYSE:ATI) with a market-capitalization of US$2.9b, rarely draw their attention. However, history shows that overlooked mid-cap companies have performed better on a risk-adjusted manner than the smaller and larger segment of the market. ATI’s financial liquidity and debt position will be analysed in this article, to get an idea of whether the company can fund opportunities for strategic growth and maintain strength through economic downturns. Note that this information is centred entirely on financial health and is a top-level understanding, so I encourage you to look further into ATI here.
Want to participate in a short research study? Help shape the future of investing tools and you could win a $250 gift card!
View our latest analysis for Allegheny Technologies
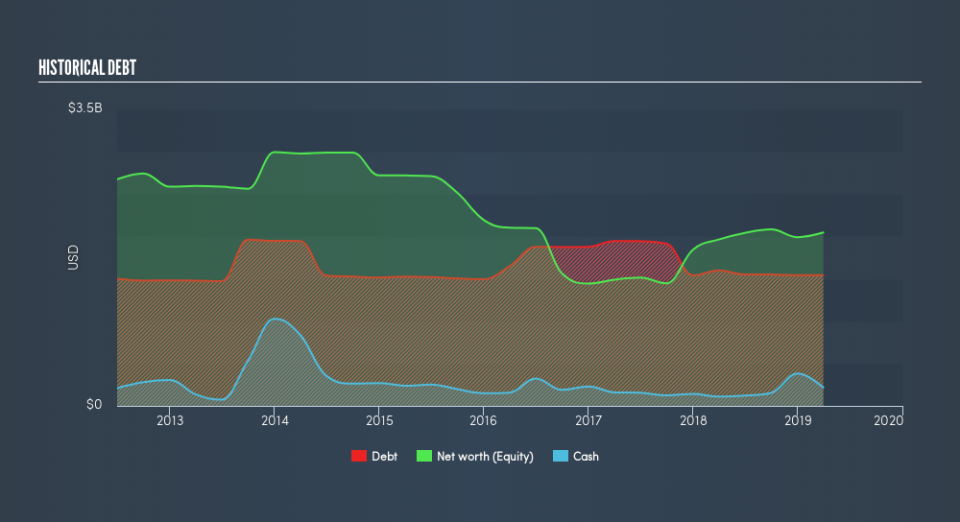
Does ATI Produce Much Cash Relative To Its Debt?
ATI has sustained its debt level by about US$1.5b over the last 12 months which accounts for long term debt. At this current level of debt, the current cash and short-term investment levels stands at US$217m to keep the business going. Moreover, ATI has generated US$310m in operating cash flow during the same period of time, resulting in an operating cash to total debt ratio of 20%, meaning that ATI’s debt is appropriately covered by operating cash.
Can ATI pay its short-term liabilities?
With current liabilities at US$760m, it seems that the business has been able to meet these obligations given the level of current assets of US$2.2b, with a current ratio of 2.87x. The current ratio is the number you get when you divide current assets by current liabilities. Usually, for Metals and Mining companies, this is a suitable ratio since there is a bit of a cash buffer without leaving too much capital in a low-return environment.
Does ATI face the risk of succumbing to its debt-load?
ATI is a relatively highly levered company with a debt-to-equity of 75%. This is not uncommon for a mid-cap company given that debt tends to be lower-cost and at times, more accessible. We can test if ATI’s debt levels are sustainable by measuring interest payments against earnings of a company. Ideally, earnings before interest and tax (EBIT) should cover net interest by at least three times. For ATI, the ratio of 2.99x suggests that interest is not strongly covered, which means that debtors may be less inclined to loan the company more money, reducing its headroom for growth through debt.
Next Steps:
ATI’s high cash coverage means that, although its debt levels are high, the company is able to utilise its borrowings efficiently in order to generate cash flow. Since there is also no concerns around ATI's liquidity needs, this may be its optimal capital structure for the time being. Keep in mind I haven't considered other factors such as how ATI has been performing in the past. You should continue to research Allegheny Technologies to get a more holistic view of the mid-cap by looking at:
Future Outlook: What are well-informed industry analysts predicting for ATI’s future growth? Take a look at our free research report of analyst consensus for ATI’s outlook.
Valuation: What is ATI worth today? Is the stock undervalued, even when its growth outlook is factored into its intrinsic value? The intrinsic value infographic in our free research report helps visualize whether ATI is currently mispriced by the market.
Other High-Performing Stocks: Are there other stocks that provide better prospects with proven track records? Explore our free list of these great stocks here.
We aim to bring you long-term focused research analysis driven by fundamental data. Note that our analysis may not factor in the latest price-sensitive company announcements or qualitative material.
If you spot an error that warrants correction, please contact the editor at editorial-team@simplywallst.com. This article by Simply Wall St is general in nature. It does not constitute a recommendation to buy or sell any stock, and does not take account of your objectives, or your financial situation. Simply Wall St has no position in the stocks mentioned. Thank you for reading.
