
 Yahoo Finance
 Allegiant (ALGT) Stock Up 1.2% on Q1 Earnings & Revenue Beat
Allegiant Travel Company's (ALGT) shares have gained 1.2% since its first-quarter 2024 earnings release on May 7. Quarterly earnings 57 cents beat Zacks Consensus Estimate of 51 cents but declined 81.3% year over year. Operating revenues of $656.4 million outperformed the Zacks Consensus Estimate of $648.4 million and increased 1% on a year-over-year basis.
Passenger revenues, which accounted for the bulk (88%) of the top line, fell 4.8% on a year-over-year basis. Air traffic (measured in revenue passenger miles) for scheduled service fell 1.1% year over year in the quarter under review. Capacity (measured in available seat miles or ASMs) grew 1.4% from the year-ago number. Load factor (percentage of seats filled by passengers) inched down to 83.8% from 85.8% in the reported quarter, as traffic did not outperform capacity.
Allegiant Travel Company Price, Consensus and EPS Surprise
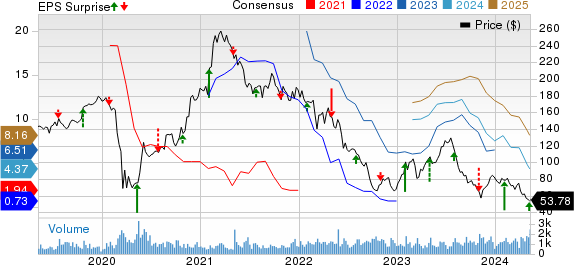
Allegiant Travel Company price-consensus-eps-surprise-chart | Allegiant Travel Company Quote
Operating cost per available seat miles, excluding fuel, jumped 14.5% year over year to 8.87 cents. Average fuel cost per gallon (scheduled) decreased 12% to $3.01. Total scheduled service passenger revenue per available seat miles fell to 13.23 cents from 13.89 cents a year ago.
Liquidity
As of Mar 31, 2024, Allegiant’s total unrestricted cash and investments were $853.7 million compared with $870.7 million at the fourth-quarter end. Long-term debt and finance lease obligations (net of current maturities and related costs) totaled $1,789.6 million compared with $1,819.7 million at the prior-quarter end.
Guidance
For second-quarter 2024, ASM (for scheduled service) is expected to decrease 1% on a year-over-year basis. Total system ASM is projected to decline 1% on a year-over-year basis.
Operating margin is expected to be between 7% and 9%. EPS (airline) is anticipated to be in the $1.25-$1.75 range. Fuel cost per gallon is suggested to be $2.90.
For 2024, ASM (for scheduled service) is now expected to increase 2-4% on a year-over-year basis (prior view: up 2-6%). Total system ASM is now projected to increase 2-4% on a year-over-year basis (prior view: up 2-6%).
Interest expenses are now forecasted to be in the range of $135-$145 million (prior view: $140-$150 million).
Under airline capex, aircraft, engines, induction costs and pre-delivery deposits are now expected to be in the $230-$250 millionband(prior view: $535-$555 million). Capitalized deferred heavy maintenance is still envisioned to be between $80 million and $90 million. Other airline capital expenditures are expected to be between $160 and $170million (prior view: $155 - $165 million).
The company aims to expand its fleet size to 126 at the end of 2024 (prior view: 130).
Allegiant carries a Zacks Rank #3 (Hold). You can see the complete list of today’s Zacks #1 Rank (Strong Buy) stocks here
Performances of Other Transportation Companies
Delta Air Lines DAL reported first-quarter 2024 earnings (excluding 39 cents from non-recurring items) of 45 cents per share, which comfortably beat the Zacks Consensus Estimate of 36 cents. Earnings increased 80% on a year-over-year basis.
Revenues of $13.75 billion surpassed the Zacks Consensus Estimate of $12.84 billion and increased 7.75% on a year-over-year basis, driven by strong air-travel demand. Adjusted operating revenues (excluding third-party refinery sales) came in at $12.56 billion, up 6% year over year.
United Airlines Holdings, Inc.UAL reported first-quarter 2024 loss per share (excluding 23 cents from non-recurring items) of 15 cents, which was narrower than the Zacks Consensus Estimate of a loss of 53 cents. In the year-ago reported quarter, UAL reported a loss of 63 cents per share.
Operating revenues of $12,539 million beat the Zacks Consensus Estimate of $12,428.4 million. The top line increased 9.7% year over year due to upbeat air-travel demand. This was driven by a 10.1% rise in passenger revenues (accounting for 90.2% of the top line) to $11,313 million. Almost 39,325 passengers traveled on UAL flights in the first quarter, up 6.8% year over year.
J.B. Hunt Transport Services, Inc.’s JBHT first-quarter 2024 earnings of $1.22 per share missed the Zacks Consensus Estimate of $1.53 and declined 35.5% year over year.
JBHT’s total operating revenues of $2,944 million missed the Zacks Consensus Estimate of $3,117.1 million and fell 8.8% year over year. Total operating revenues, excluding fuel surcharge revenue, fell 7% year over year. The downfall was owing to a 9% decrease in segment gross revenue per load in both Intermodal (JBI) and Truckload (JBT), 22% fewer loads in Integrated Capacity Solution (ICS), and a modest decline in average trucks and productivity in Dedicated Contract Services (DCS). Revenue declines in JBI, ICS, JBT and DCS were partially offset by Final Mile Services (FMS) revenue growth of 2%, primarily driven by new contracts implemented over the past year.
Want the latest recommendations from Zacks Investment Research? Today, you can download 7 Best Stocks for the Next 30 Days. Click to get this free report
Delta Air Lines, Inc. (DAL) : Free Stock Analysis Report
United Airlines Holdings Inc (UAL) : Free Stock Analysis Report
J.B. Hunt Transport Services, Inc. (JBHT) : Free Stock Analysis Report
Allegiant Travel Company (ALGT) : Free Stock Analysis Report
