
 Yahoo Finance
 Alliance Data Systems (NYSE:ADS) Might Have The Makings Of A Multi-Bagger
What are the early trends we should look for to identify a stock that could multiply in value over the long term? Amongst other things, we'll want to see two things; firstly, a growing return on capital employed (ROCE) and secondly, an expansion in the company's amount of capital employed. If you see this, it typically means it's a company with a great business model and plenty of profitable reinvestment opportunities. So on that note, Alliance Data Systems (NYSE:ADS) looks quite promising in regards to its trends of return on capital.
What is Return On Capital Employed (ROCE)?
Just to clarify if you're unsure, ROCE is a metric for evaluating how much pre-tax income (in percentage terms) a company earns on the capital invested in its business. To calculate this metric for Alliance Data Systems, this is the formula:
Return on Capital Employed = Earnings Before Interest and Tax (EBIT) ÷ (Total Assets - Current Liabilities)
0.11 = US$1.2b ÷ (US$22b - US$11b) (Based on the trailing twelve months to June 2021).
Therefore, Alliance Data Systems has an ROCE of 11%. In absolute terms, that's a pretty normal return, and it's somewhat close to the IT industry average of 12%.
View our latest analysis for Alliance Data Systems
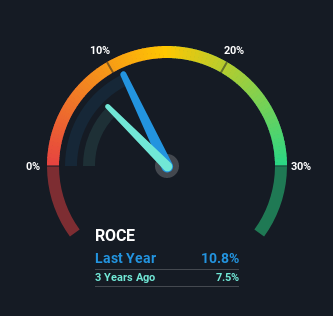
Above you can see how the current ROCE for Alliance Data Systems compares to its prior returns on capital, but there's only so much you can tell from the past. If you're interested, you can view the analysts predictions in our free report on analyst forecasts for the company.
The Trend Of ROCE
We're pretty happy with how the ROCE has been trending at Alliance Data Systems. The figures show that over the last five years, returns on capital have grown by 44%. That's a very favorable trend because this means that the company is earning more per dollar of capital that's being employed. Speaking of capital employed, the company is actually utilizing 27% less than it was five years ago, which can be indicative of a business that's improving its efficiency. If this trend continues, the business might be getting more efficient but it's shrinking in terms of total assets.
On a side note, we noticed that the improvement in ROCE appears to be partly fueled by an increase in current liabilities. Effectively this means that suppliers or short-term creditors are now funding 48% of the business, which is more than it was five years ago. Given it's pretty high ratio, we'd remind investors that having current liabilities at those levels can bring about some risks in certain businesses.
The Bottom Line On Alliance Data Systems' ROCE
From what we've seen above, Alliance Data Systems has managed to increase it's returns on capital all the while reducing it's capital base. Astute investors may have an opportunity here because the stock has declined 47% in the last five years. That being the case, research into the company's current valuation metrics and future prospects seems fitting.
On a final note, we found 3 warning signs for Alliance Data Systems (2 can't be ignored) you should be aware of.
While Alliance Data Systems may not currently earn the highest returns, we've compiled a list of companies that currently earn more than 25% return on equity. Check out this free list here.
This article by Simply Wall St is general in nature. We provide commentary based on historical data and analyst forecasts only using an unbiased methodology and our articles are not intended to be financial advice. It does not constitute a recommendation to buy or sell any stock, and does not take account of your objectives, or your financial situation. We aim to bring you long-term focused analysis driven by fundamental data. Note that our analysis may not factor in the latest price-sensitive company announcements or qualitative material. Simply Wall St has no position in any stocks mentioned.
Have feedback on this article? Concerned about the content? Get in touch with us directly. Alternatively, email editorial-team (at) simplywallst.com.
