
 Yahoo Finance
 Which altcoins have outperformed Bitcoin over the last 12 months?
2019 proved to be a roller-coaster year for the Bitcoin and altcoin markets.
Bitcoin started the year at lows of around $3,150 before threatening to break its all-time high in the summer, surging all the way up to $14,000.
At the time of writing, Bitcoin is recording higher lows and is trading well above $8,100. As is usually the case, for altcoins to reach new all-time highs, Bitcoin needs to pump first.
However, in this article, I’ll take a look at the top four altcoins that have outperformed Bitcoin over the last year.
The leaders
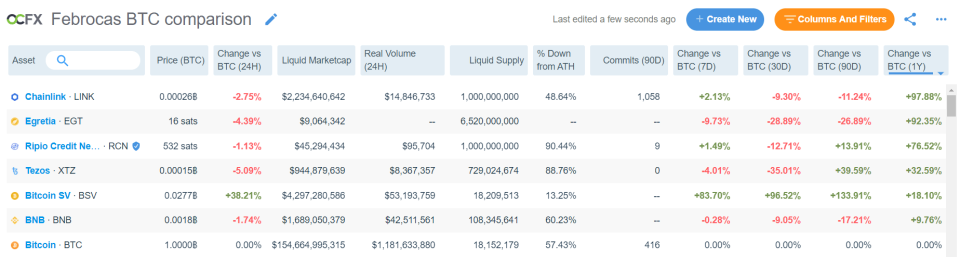
Before I dive a bit deeper into each altcoin individually, let me take a moment to compare the top-performing altcoins vs Bitcoin over the last 12 months.
At the time of writing, Chainlink (LINK) is ranked as number one with close to 100% gains since last year, while Bitcoin SV has been experiencing some impressive momentum recently.
Next up is Egretia (EGT) with gains topping 90%, followed closely by Ripio Credit Network (RCN) and Tezos (XTZ) with gains of 76% and 30% respectively.
Finally, we have Bitcoin SV (BSV) with gains of 15% and Binance Coin (BNB) with gains of 10%.
For the time being, I’ll ignore Egretia due to low volume.
So let’s take a closer look at the biggest winners over the last year: Chainlink, Ripio, Tezos, and Bitcoin SV.
LINK/BTC

Here we can see the chart for Chainlink vs Bitcoin, courtesy of TradingView.
Fundamentally, the Chainlink network provides reliable tamper-proof inputs and outputs for complex smart contracts on any blockchain.
LINK is currently trading above 26,200 sats. At the moment, it’s looking quite grim for Chainlink as the 20-day EMA and the 50-day EMA are close to crossing to the downside.
Despite this latest downtrend, LINK is still up over 90% against Bitcoin since last year. At its peak, Chainlink was up over 330% versus Bitcoin.
However, LINK wasn’t able to hold its gains and the volume profile shows the coin could be in dire straits. If LINK is unable to hold support near 24,000 sats, it could drop further down towards the next levels of support at 20,000 and 12,000 sats.
It’s important to underline however that Chainlink dumped over 50% between July and September last year before making its way to new all-time highs.
This means we could see LINK drop below 18,000 sats before pumping again towards a new high.
If buyers remain in control, I expect LINK to pump sometime during Q1 2020. The altcoin historically reaches new all-time highs every 115 to 130 days, so we could see a new high during February or March 2020.
On the other hand, if price drops down further below 12,000 sats and is incapable of pushing towards the 200-day EMA, I would switch my position and avoid LINK.
RCN/BTC

Ripio Credit Network (RCN) is an open global credit network that connects lenders, borrowers, and loan originators on the blockchain to create frictionless, transparent, and borderless debt markets.
Essentially, Ripio harnesses blockchain technology to bridge credit supply and demand across borders, creating a new ecosystem for decentralised debt products.
Looking at the chart above, courtesy of TradingView, we can quickly see price action isn’t looking too good for RCN at the moment. While the altcoin is still over 340% above its 2019 lows, it just recently broke its positive trend.
Price went from a high of 700 sats in December 2019 to 531 sats where it sits now. That represents a 25% drop in just a month.
In addition, RCN tested its 20-day EMA back in late October 2019. The altcoin rebounded and pushed from 400 sats to over 700 sats. The trend is now broken as RCN has dropped back towards the 50-day EMA.
If the altcoin is able to push above all its EMAs during the next rally, I would expect price to pump towards new all-time highs. On the other hand, if RCN drops further, I would avoid making new entries.
XTZ/BTC

Next we have the chart for Tezos vs Bitcoin, once more courtesy of TradingView.
Fundamentally, Tezos is an open-source platform for assets and applications backed by a global community of validators, researchers, and builders.
Although there was a huge pump from November to December following the launch of Tezos’ mainnet, price has now dropped substantially.
XTZ dropped from a high of over 25,000 sats to 15,000 sats, where it is currently sitting. The altcoin grew over 200% against Bitcoin before a 40% drop.
Tezos has already broken the 20-day and 50-day EMAs to the downside, and I expect XTZ to break the 200-day EMA as well as price action is looking quite grim for the altcoin.
The volume profile doesn’t show a major support interval until the 12,000 sats range, meaning we could see further substantial drops.
My current analysis is that if XTZ isn’t capable of breaking above its 200-day and 50-day EMAs soon, I’m expecting Tezos to consolidate between 10,000 and 12,000 sats for quite some time.
Nevertheless, it seems a great time to wait for XTZ to cool down before making any serious moves.
BSV/BTC
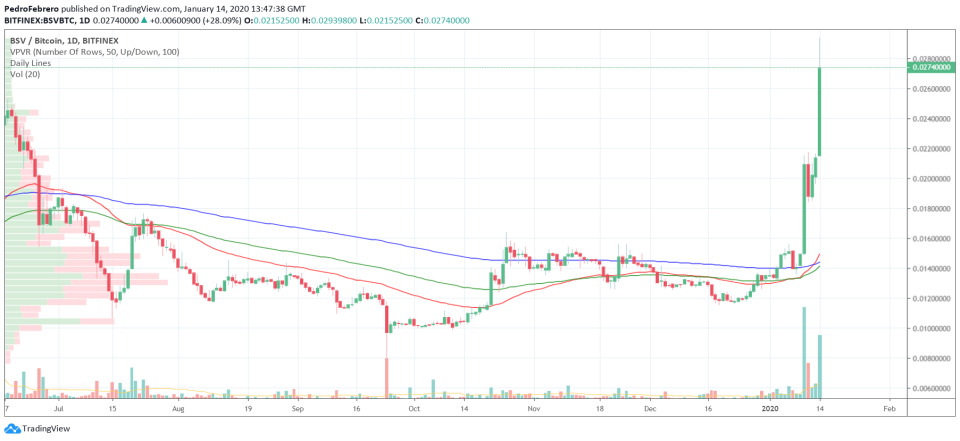
Bitcoin SV has been performing very well versus BTC so far in 2020.
At the time of writing, BSV has pumped from 1,4o0,000 sats towards 2,740,000. That’s close to a 50% pump in just a few days.
Since its bottom in early October 2019, BSV has been recording higher highs. Looking at the volume profile on the left, strong support is shown between 1,200,000 sats and 1,400,000 sats.
All EMAs are currently spiking as well, and the 20-day EMA has crossed both the 50-day and the 200-day EMAs. If the trend continues, I expect BSV to continuing making new highs.
The next target is around 3,400,000 sats, meaning BSV could still pump at least a further 50%.
Safe trades!
Disclaimer: The views expressed in this article are the author’s only. This article isn’t financial advice or promotional material; it represents my personal opinion and should not be attributed to Coin Rivet.
The post Which altcoins have outperformed Bitcoin over the last 12 months? appeared first on Coin Rivet.
