
 Yahoo Finance
 Amazon.com, Inc. (NASDAQ:AMZN) Is Employing Capital Very Effectively

Today we are going to look at Amazon.com, Inc. (NASDAQ:AMZN) to see whether it might be an attractive investment prospect. Specifically, we're going to calculate its Return On Capital Employed (ROCE), in the hopes of getting some insight into the business.
Firstly, we'll go over how we calculate ROCE. Next, we'll compare it to others in its industry. Last but not least, we'll look at what impact its current liabilities have on its ROCE.
Understanding Return On Capital Employed (ROCE)
ROCE measures the 'return' (pre-tax profit) a company generates from capital employed in its business. Generally speaking a higher ROCE is better. Overall, it is a valuable metric that has its flaws. Renowned investment researcher Michael Mauboussin has suggested that a high ROCE can indicate that 'one dollar invested in the company generates value of more than one dollar'.
How Do You Calculate Return On Capital Employed?
The formula for calculating the return on capital employed is:
Return on Capital Employed = Earnings Before Interest and Tax (EBIT) ÷ (Total Assets - Current Liabilities)
Or for Amazon.com:
0.10 = US$14b ÷ (US$225b - US$88b) (Based on the trailing twelve months to December 2019.)
Therefore, Amazon.com has an ROCE of 10%.
View our latest analysis for Amazon.com
Is Amazon.com's ROCE Good?
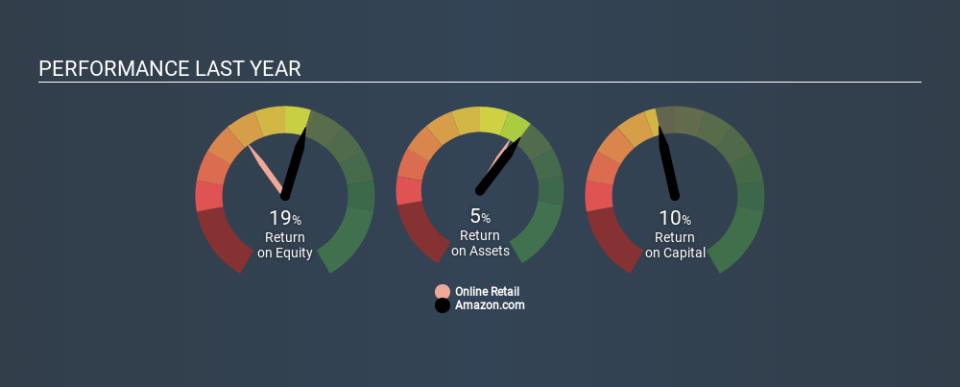
One way to assess ROCE is to compare similar companies. Amazon.com's ROCE appears to be substantially greater than the 6.2% average in the Online Retail industry. We would consider this a positive, as it suggests it is using capital more effectively than other similar companies. Separate from Amazon.com's performance relative to its industry, its ROCE in absolute terms looks satisfactory, and it may be worth researching in more depth.
The image below shows how Amazon.com's ROCE compares to its industry, and you can click it to see more detail on its past growth.
When considering this metric, keep in mind that it is backwards looking, and not necessarily predictive. ROCE can be misleading for companies in cyclical industries, with returns looking impressive during the boom times, but very weak during the busts. ROCE is, after all, simply a snap shot of a single year. Since the future is so important for investors, you should check out our free report on analyst forecasts for Amazon.com.
Do Amazon.com's Current Liabilities Skew Its ROCE?
Current liabilities are short term bills and invoices that need to be paid in 12 months or less. Due to the way the ROCE equation works, having large bills due in the near term can make it look as though a company has less capital employed, and thus a higher ROCE than usual. To counteract this, we check if a company has high current liabilities, relative to its total assets.
Amazon.com has total assets of US$225b and current liabilities of US$88b. Therefore its current liabilities are equivalent to approximately 39% of its total assets. Amazon.com has a medium level of current liabilities, which would boost the ROCE.
Our Take On Amazon.com's ROCE
With a decent ROCE, the company could be interesting, but remember that the level of current liabilities make the ROCE look better. Amazon.com shapes up well under this analysis, but it is far from the only business delivering excellent numbers . You might also want to check this free collection of companies delivering excellent earnings growth.
If you like to buy stocks alongside management, then you might just love this free list of companies. (Hint: insiders have been buying them).
If you spot an error that warrants correction, please contact the editor at editorial-team@simplywallst.com. This article by Simply Wall St is general in nature. It does not constitute a recommendation to buy or sell any stock, and does not take account of your objectives, or your financial situation. Simply Wall St has no position in the stocks mentioned.
We aim to bring you long-term focused research analysis driven by fundamental data. Note that our analysis may not factor in the latest price-sensitive company announcements or qualitative material. Thank you for reading.

