
 Yahoo Finance
 Is Ambu A/S (CPH:AMBU B) Investing Your Capital Efficiently?

Today we'll evaluate Ambu A/S (CPH:AMBU B) to determine whether it could have potential as an investment idea. To be precise, we'll consider its Return On Capital Employed (ROCE), as that will inform our view of the quality of the business.
First up, we'll look at what ROCE is and how we calculate it. Second, we'll look at its ROCE compared to similar companies. Then we'll determine how its current liabilities are affecting its ROCE.
Understanding Return On Capital Employed (ROCE)
ROCE measures the 'return' (pre-tax profit) a company generates from capital employed in its business. All else being equal, a better business will have a higher ROCE. Overall, it is a valuable metric that has its flaws. Author Edwin Whiting says to be careful when comparing the ROCE of different businesses, since 'No two businesses are exactly alike.
How Do You Calculate Return On Capital Employed?
Analysts use this formula to calculate return on capital employed:
Return on Capital Employed = Earnings Before Interest and Tax (EBIT) ÷ (Total Assets - Current Liabilities)
Or for Ambu:
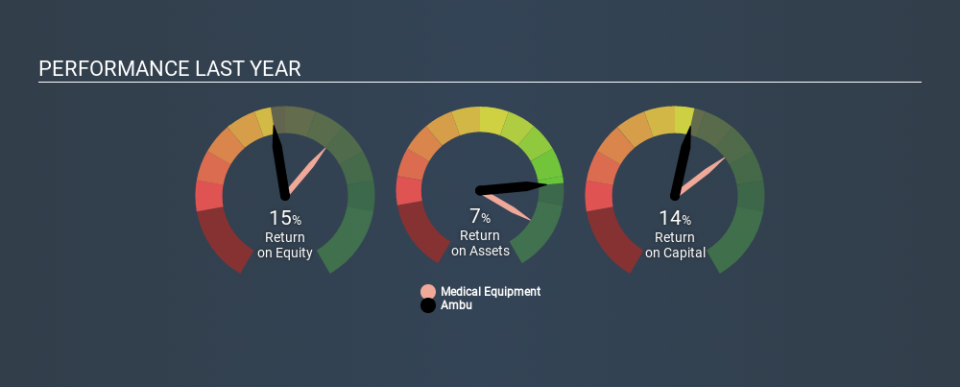
0.14 = ø480m ÷ (ø4.6b - ø1.0b) (Based on the trailing twelve months to September 2019.)
So, Ambu has an ROCE of 14%.
See our latest analysis for Ambu
Is Ambu's ROCE Good?
When making comparisons between similar businesses, investors may find ROCE useful. We can see Ambu's ROCE is meaningfully below the Medical Equipment industry average of 20%. This performance is not ideal, as it suggests the company may not be deploying its capital as effectively as some competitors. Regardless of where Ambu sits next to its industry, its ROCE in absolute terms appears satisfactory, and this company could be worth a closer look.
Ambu's current ROCE of 14% is lower than its ROCE in the past, which was 18%, 3 years ago. This makes us wonder if the business is facing new challenges. You can see in the image below how Ambu's ROCE compares to its industry. Click to see more on past growth.
It is important to remember that ROCE shows past performance, and is not necessarily predictive. ROCE can be misleading for companies in cyclical industries, with returns looking impressive during the boom times, but very weak during the busts. ROCE is only a point-in-time measure. Future performance is what matters, and you can see analyst predictions in our free report on analyst forecasts for the company.
How Ambu's Current Liabilities Impact Its ROCE
Short term (or current) liabilities, are things like supplier invoices, overdrafts, or tax bills that need to be paid within 12 months. Due to the way the ROCE equation works, having large bills due in the near term can make it look as though a company has less capital employed, and thus a higher ROCE than usual. To counter this, investors can check if a company has high current liabilities relative to total assets.
Ambu has total assets of ø4.6b and current liabilities of ø1.0b. Therefore its current liabilities are equivalent to approximately 22% of its total assets. A fairly low level of current liabilities is not influencing the ROCE too much.
Our Take On Ambu's ROCE
This is good to see, and with a sound ROCE, Ambu could be worth a closer look. Ambu shapes up well under this analysis, but it is far from the only business delivering excellent numbers . You might also want to check this free collection of companies delivering excellent earnings growth.
If you like to buy stocks alongside management, then you might just love this free list of companies. (Hint: insiders have been buying them).
If you spot an error that warrants correction, please contact the editor at editorial-team@simplywallst.com. This article by Simply Wall St is general in nature. It does not constitute a recommendation to buy or sell any stock, and does not take account of your objectives, or your financial situation. Simply Wall St has no position in the stocks mentioned.
We aim to bring you long-term focused research analysis driven by fundamental data. Note that our analysis may not factor in the latest price-sensitive company announcements or qualitative material. Thank you for reading.