
 Yahoo Finance
 American Airlines (AAL) Posts Q1 Loss on Surging Labor Costs
American Airlines’ AAL first-quarter 2024 loss (excluding 14 cents from non-recurring items) of 34 cents per share was wider than the Zacks Consensus Estimate of a loss of 28 cents. In the year-ago quarter, AAL reported earnings of 5 cents.
Operating revenues of $12.57 billion fell short of the Zacks Consensus Estimate of $12.59 billion but increased 3.1% year over year. Passenger revenues, accounting for 91.2% of the top line, increased to $11.46 billion from $11.1 billion recorded a year ago. The metric exceeded our estimate of $11.38 billion.
Cargo revenues decreased 16% to $187 million. The metric came ahead of our estimate of $148.4 million. Other revenues jumped 7.2% to $925 million, which missed our expectation of $929.8 million.
Per management, AAL achieved its best-ever first-quarter completion factor, despite headwinds pertaining to air-traffic control and weather-related woes.
American Airlines Group Inc. Price, Consensus and EPS Surprise
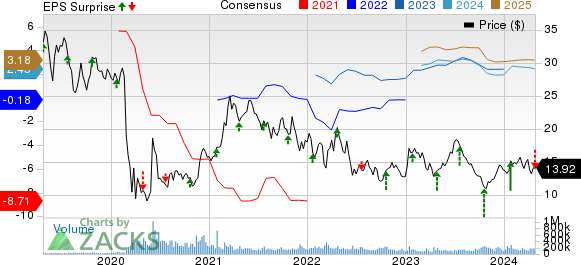
American Airlines Group Inc. price-consensus-eps-surprise-chart | American Airlines Group Inc. Quote
More on Q1 Earnings
Total revenue per available seat miles (a key measure of unit revenue: TRASM) decreased to 17.83 cents from 18.75 cents recorded a year ago. Passenger revenue per available seat miles (PRASM) decreased 4.9% to 16.25 cents. The actual PRASM figure was also lower than our expectation of 16.39 cents. Consolidated yield decreased 6.6% to 19.94 cents.
Reflecting the boost in air-travel demand, consolidated traffic (measured in revenue passenger miles) rose to 57,473 million from 52,014 million a year ago. To cater to this increased demand, capacity (measured in average seat miles) expanded to 70,516 million from 65,006 million in the year-ago quarter.
Consolidated load factor (percentage of seats filled by passengers) inched up 1.5 points to 81.5%. The actual figure for load factor was lower than our expectation of 82.9%.
Total operating costs (on a reported basis) increased 6.9% year over year to $12.56 billion, with expenses on salaries, wages and benefits growing 17.8% to $3.87 billion. The labor deal, inked with its pilots last year, contributed to the increase. Average fuel price per gallon (including related taxes) tumbled to $2.86 from $3.28 a year ago.
Consolidated operating costs per available seat mile (excluding fuel and special items) increased 2.3% to 13.49 cents. The actual figure was less than our estimate of 13.51 cents. Fuel gallon consumption increased 8% to $1.04 billion in first-quarter 2024.
American Airlines, currently carrying a Zacks Rank #3 (Hold), reduced total debt by nearly $950 million in the March quarter. AAL is now more than 80% of the way to its 2025 total debt reduction goal. You can see the complete list of today’s Zacks #1 Rank (Strong Buy) stocks here.
Outlook
Management expects second-quarter 2024 TRASM to be between 1% and 3%, lower than second-quarter 2023 actuals. System capacity is estimated to increase 7-9% from second-quarter 2023 actuals.
Fuel cost per gallon is projected in the range of $2.75-$2.95. Fuel gallon consumption is expected to be between $1.12 billion and $1.14 billion. Adjusted operating margin is anticipated in the 9.5-11.5% range.
The company envisions total non-operating expenses to be $350 million. Cost per available seat miles (adjusted) is estimated to increase 1-3%.
Driven by the expectation of strong air-travel demand in the upcoming summer season, AAL projects the June-end quarter's earnings per share (excluding net special items) in the $1.15-$1.45 per share range using a share count of 722.5 million. The Zacks Consensus Estimate is currently pegged at $1.25, lower than the mid-point ($1.30) of the guided range.
Management anticipates 2024 capacity to improve in mid-single digits from the year-ago levels. Cost per available seat miles (adjusted) is expected to increase 0.5-3.5% from the prior-year levels.
The company still expects 2024 earnings (on an adjusted basis) in the band of $2.25-$3.25 per share. The Zacks Consensus Estimate of $2.45 lies below the mid-point, i.e. $2.75, of the guided range. AAL still expects full-year free cash flow to be approximately $2 billion.
Q1 Performances of Some Other Transportation Companies
Delta Air Lines DAL reported first-quarter 2024 earnings (excluding 39 cents from non-recurring items) of 45 cents per share, which comfortably beat the Zacks Consensus Estimate of 36 cents. Earnings increased 80% on a year-over-year basis.
Revenues of $13.75 billion surpassed the Zacks Consensus Estimate of $12.84 billion and increased 7.75% on a year-over-year basis, driven by strong air travel demand. Adjusted operating revenues (excluding third-party refinery sales) came in at $12.56 billion, up 6% year over year. Delta expects adjusted earnings of $2.20-$2.50 per share for second-quarter 2024.
CSX Corporation's CSX first-quarter 2024 earnings per share of 46 cents beat the Zacks Consensus Estimate by a penny. However, the bottom line declined 4% year over year.
Total revenues of $3.68 billion surpassed the Zacks Consensus Estimate of $3.65 billion. The top line decreased 1% year over year due to a lower fuel surcharge, a decline in other revenues, lower trucking revenues and reduced export coal prices.
Want the latest recommendations from Zacks Investment Research? Today, you can download 7 Best Stocks for the Next 30 Days. Click to get this free report
CSX Corporation (CSX) : Free Stock Analysis Report
Delta Air Lines, Inc. (DAL) : Free Stock Analysis Report
American Airlines Group Inc. (AAL) : Free Stock Analysis Report
