
 Yahoo Finance
 American Airlines' (AAL) Q3 Earnings Top Estimates, Rise Y/Y
American Airlines’ AAL third-quarter 2019 earnings (excluding 46 cents from non-recurring items) of $1.42 per share surpassed the Zacks Consensus Estimate by 4 cents. Moreover, the bottom line improved 25.7% on a year-over-year basis, driven by low fuel costs.
Meanwhile, revenues came in at $11,911 million, falling short of the Zacks Consensus Estimate of $11,940.9 million. However, the top line improved 3% on a year-over-year basis. Passenger revenues, which accounted for bulk of the top line (92.3%), increased 4.1% owing to strong demand for air travel. But cargo revenues declined 20% to $208 million, mainly due to a 17% reduction in cargo ton miles. Other revenues also decreased 4.1%.
Total revenue per available seat miles (TRASM: a key measure of unit revenues) inched up 2% to 15.71 cents in the reported quarter. Passenger revenue per available seat miles (PRASM) increased 3% to 14.5 cents in the third quarter as well. However, consolidated yield dipped 0.7%.
American Airlines Group Inc. Price, Consensus and EPS Surprise
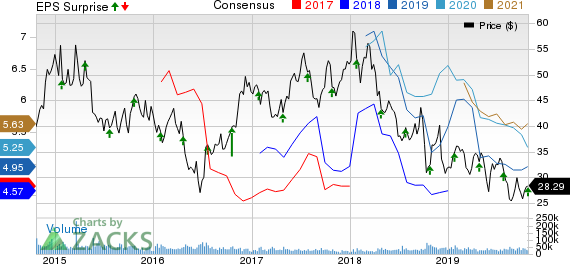
American Airlines Group Inc. price-consensus-eps-surprise-chart | American Airlines Group Inc. Quote
While traffic (measured by revenue passenger miles) was up 4.9%, capacity (measured by average seat miles) expanded 1%. Consolidated load factor (percentage of seats filled by passengers) also increased 320 basis points to 85.6% as traffic growth outpaced capacity expansion.
Total operating costs (on a reported basis) were up 2.1% year over year to $11,103 million with expenses pertaining to salaries, wages and benefits rising 2.8%. Consolidated operating costs per available seat miles (CASM: excluding fuel and special items) too increased 4.8% to 11.07 cents. This increase was due to lower-than-expected capacity following the prolonged grounding of Boeing 737 MAX jets and escalated costs pertaining to salaries, benefits, maintenance and other things. Average fuel cost per gallon (on a consolidated basis: including taxes) declined 11.1% to $2.05.
American Airlines rewarded its shareholders to the tune of $244 million in the reported quarter through buybacks ($200 million) and dividends ($44 million). Furthermore, the carrier declared a dividend of 10 cents per share. The amount will be paid out on Nov 20 to the shareholders of record on Nov 6.
Q4 Outlook
TRASM is expected to be either flat or increase up to 2% on a year-over-year basis. Pre-tax margin excluding special items is projected in the range of 5-7%. Additionally, fuel costs are estimated between $1.99 and $2.04 per gallon. The company predicts fourth-quarter costs per available seat miles (excluding fuel and special items) to increase in the 2-4% band. Capacity is expected to grow approximately 2.7% in the December quarter.
2019 Outlook
American Airlines anticipates its full-year pre-tax income to be hurt by roughly $540 million due to the grounding of the Boeing 737 MAX jets. American Airlines with 24 Boeing 737 MAX jets in its fleet expects the jets to remain grounded through Jan 15, 2020.
Capacity is expected to increase 1%. Cost per available seat miles (excluding fuel, new labor deals and special items) is anticipated to rise in the 3.5-4.5% range. The company’s capex projection for the current year is pegged at $4.3 billion.
American Airlines, carrying a Zacks Rank #3 (Hold), now expects 2019 earnings per share between $4.5 and $5.5 (earlier outlook: $4.5-$6). The mid-point of the guided range ($5) is above the Zacks Consensus Estimate of $4.95 per share.
You can see the complete list of today’s Zacks #1 Rank (Strong Buy) stocks here.
Upcoming Releases
Investors interested in the Zacks Airline industry are keenly awaiting third-quarter 2019 earnings reports from key players like SkyWest SKYW, GOL Linhas GOL and Copa Holdings CPA. While SkyWest is scheduled to report third-quarter results on Oct 30, GOL Linhas and Copa Holdings will do so on Oct 31 and Nov 13, respectively.
Today's Best Stocks from Zacks
Would you like to see the updated picks from our best market-beating strategies? From 2017 through 2018, while the S&P 500 gained +15.8%, five of our screens returned +38.0%, +61.3%, +61.6%, +68.1%, and +98.3%.
This outperformance has not just been a recent phenomenon. From 2000 – 2018, while the S&P averaged +4.8% per year, our top strategies averaged up to +56.2% per year.
See their latest picks free >>
Want the latest recommendations from Zacks Investment Research? Today, you can download 7 Best Stocks for the Next 30 Days. Click to get this free report
SkyWest, Inc. (SKYW) : Free Stock Analysis Report
Copa Holdings, S.A. (CPA) : Free Stock Analysis Report
Gol Linhas Aereas Inteligentes S.A. (GOL) : Free Stock Analysis Report
American Airlines Group Inc. (AAL) : Free Stock Analysis Report
To read this article on Zacks.com click here.
Zacks Investment Research
