
 Yahoo Finance
 American Electric Power Company's (NASDAQ:AEP) earnings growth rate lags the 9.9% CAGR delivered to shareholders
If you buy and hold a stock for many years, you'd hope to be making a profit. But more than that, you probably want to see it rise more than the market average. But American Electric Power Company, Inc. (NASDAQ:AEP) has fallen short of that second goal, with a share price rise of 36% over five years, which is below the market return. Zooming in, the stock is up a respectable 16% in the last year.
Although American Electric Power Company has shed US$1.9b from its market cap this week, let's take a look at its longer term fundamental trends and see if they've driven returns.
See our latest analysis for American Electric Power Company
While markets are a powerful pricing mechanism, share prices reflect investor sentiment, not just underlying business performance. By comparing earnings per share (EPS) and share price changes over time, we can get a feel for how investor attitudes to a company have morphed over time.
During five years of share price growth, American Electric Power Company achieved compound earnings per share (EPS) growth of 29% per year. This EPS growth is higher than the 6% average annual increase in the share price. So one could conclude that the broader market has become more cautious towards the stock.
The graphic below depicts how EPS has changed over time (unveil the exact values by clicking on the image).
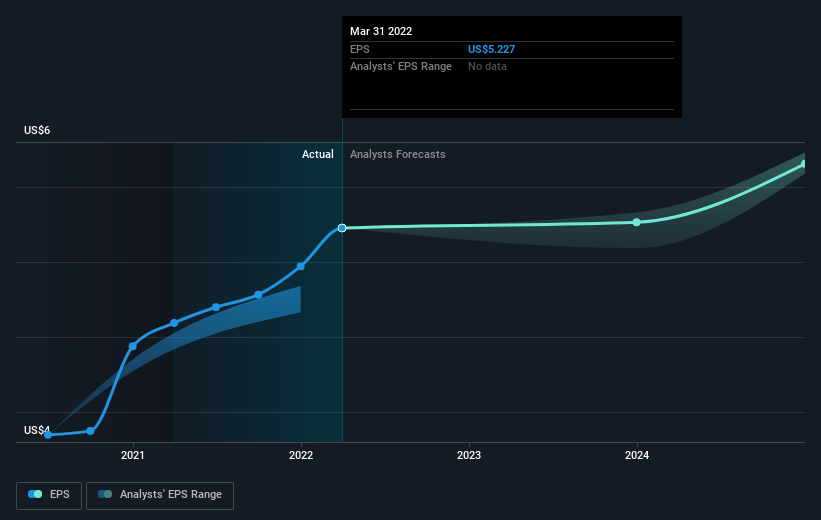
We know that American Electric Power Company has improved its bottom line lately, but is it going to grow revenue? If you're interested, you could check this free report showing consensus revenue forecasts.
What About Dividends?
It is important to consider the total shareholder return, as well as the share price return, for any given stock. The TSR incorporates the value of any spin-offs or discounted capital raisings, along with any dividends, based on the assumption that the dividends are reinvested. Arguably, the TSR gives a more comprehensive picture of the return generated by a stock. As it happens, American Electric Power Company's TSR for the last 5 years was 61%, which exceeds the share price return mentioned earlier. The dividends paid by the company have thusly boosted the total shareholder return.
A Different Perspective
It's nice to see that American Electric Power Company shareholders have received a total shareholder return of 20% over the last year. And that does include the dividend. That gain is better than the annual TSR over five years, which is 10%. Therefore it seems like sentiment around the company has been positive lately. In the best case scenario, this may hint at some real business momentum, implying that now could be a great time to delve deeper. While it is well worth considering the different impacts that market conditions can have on the share price, there are other factors that are even more important. Case in point: We've spotted 3 warning signs for American Electric Power Company you should be aware of, and 1 of them is concerning.
If you like to buy stocks alongside management, then you might just love this free list of companies. (Hint: insiders have been buying them).
Please note, the market returns quoted in this article reflect the market weighted average returns of stocks that currently trade on US exchanges.
Have feedback on this article? Concerned about the content? Get in touch with us directly. Alternatively, email editorial-team (at) simplywallst.com.
This article by Simply Wall St is general in nature. We provide commentary based on historical data and analyst forecasts only using an unbiased methodology and our articles are not intended to be financial advice. It does not constitute a recommendation to buy or sell any stock, and does not take account of your objectives, or your financial situation. We aim to bring you long-term focused analysis driven by fundamental data. Note that our analysis may not factor in the latest price-sensitive company announcements or qualitative material. Simply Wall St has no position in any stocks mentioned.
