
 Yahoo Finance
 American International Group's (NYSE:AIG) underlying earnings growth outpaced the respectable return generated for shareholders over the past five years
The main point of investing for the long term is to make money. But more than that, you probably want to see it rise more than the market average. But American International Group, Inc. (NYSE:AIG) has fallen short of that second goal, with a share price rise of 60% over five years, which is below the market return. However, more recent buyers should be happy with the increase of 42% over the last year.
In light of the stock dropping 5.4% in the past week, we want to investigate the longer term story, and see if fundamentals have been the driver of the company's positive five-year return.
See our latest analysis for American International Group
In his essay The Superinvestors of Graham-and-Doddsville Warren Buffett described how share prices do not always rationally reflect the value of a business. One imperfect but simple way to consider how the market perception of a company has shifted is to compare the change in the earnings per share (EPS) with the share price movement.
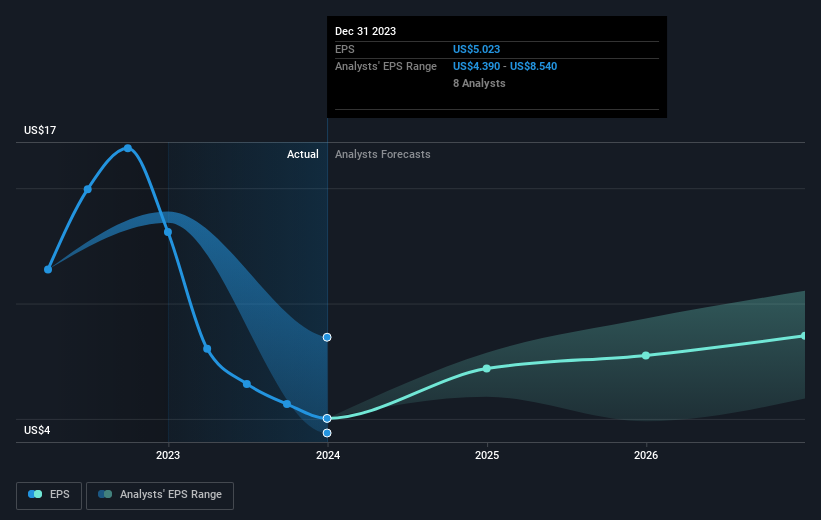
During the last half decade, American International Group became profitable. That would generally be considered a positive, so we'd hope to see the share price to rise.
You can see how EPS has changed over time in the image below (click on the chart to see the exact values).
It is of course excellent to see how American International Group has grown profits over the years, but the future is more important for shareholders. You can see how its balance sheet has strengthened (or weakened) over time in this free interactive graphic.
What About Dividends?
It is important to consider the total shareholder return, as well as the share price return, for any given stock. The TSR is a return calculation that accounts for the value of cash dividends (assuming that any dividend received was reinvested) and the calculated value of any discounted capital raisings and spin-offs. Arguably, the TSR gives a more comprehensive picture of the return generated by a stock. In the case of American International Group, it has a TSR of 84% for the last 5 years. That exceeds its share price return that we previously mentioned. This is largely a result of its dividend payments!
A Different Perspective
It's nice to see that American International Group shareholders have received a total shareholder return of 45% over the last year. And that does include the dividend. That's better than the annualised return of 13% over half a decade, implying that the company is doing better recently. In the best case scenario, this may hint at some real business momentum, implying that now could be a great time to delve deeper. It's always interesting to track share price performance over the longer term. But to understand American International Group better, we need to consider many other factors. Even so, be aware that American International Group is showing 1 warning sign in our investment analysis , you should know about...
If you would prefer to check out another company -- one with potentially superior financials -- then do not miss this free list of companies that have proven they can grow earnings.
Please note, the market returns quoted in this article reflect the market weighted average returns of stocks that currently trade on American exchanges.
Have feedback on this article? Concerned about the content? Get in touch with us directly. Alternatively, email editorial-team (at) simplywallst.com.
This article by Simply Wall St is general in nature. We provide commentary based on historical data and analyst forecasts only using an unbiased methodology and our articles are not intended to be financial advice. It does not constitute a recommendation to buy or sell any stock, and does not take account of your objectives, or your financial situation. We aim to bring you long-term focused analysis driven by fundamental data. Note that our analysis may not factor in the latest price-sensitive company announcements or qualitative material. Simply Wall St has no position in any stocks mentioned.
