
 Yahoo Finance
 Amerigo Resources Ltd.'s (TSE:ARG) Recent Stock Performance Looks Decent- Can Strong Fundamentals Be the Reason?
Amerigo Resources' (TSE:ARG) stock is up by 5.6% over the past three months. Given that the market rewards strong financials in the long-term, we wonder if that is the case in this instance. Particularly, we will be paying attention to Amerigo Resources' ROE today.
Return on Equity or ROE is a test of how effectively a company is growing its value and managing investors’ money. Put another way, it reveals the company's success at turning shareholder investments into profits.
See our latest analysis for Amerigo Resources
How Is ROE Calculated?
The formula for ROE is:
Return on Equity = Net Profit (from continuing operations) ÷ Shareholders' Equity
So, based on the above formula, the ROE for Amerigo Resources is:
28% = US$39m ÷ US$141m (Based on the trailing twelve months to September 2021).
The 'return' is the amount earned after tax over the last twelve months. Another way to think of that is that for every CA$1 worth of equity, the company was able to earn CA$0.28 in profit.
What Is The Relationship Between ROE And Earnings Growth?
Thus far, we have learned that ROE measures how efficiently a company is generating its profits. Based on how much of its profits the company chooses to reinvest or "retain", we are then able to evaluate a company's future ability to generate profits. Generally speaking, other things being equal, firms with a high return on equity and profit retention, have a higher growth rate than firms that don’t share these attributes.
A Side By Side comparison of Amerigo Resources' Earnings Growth And 28% ROE
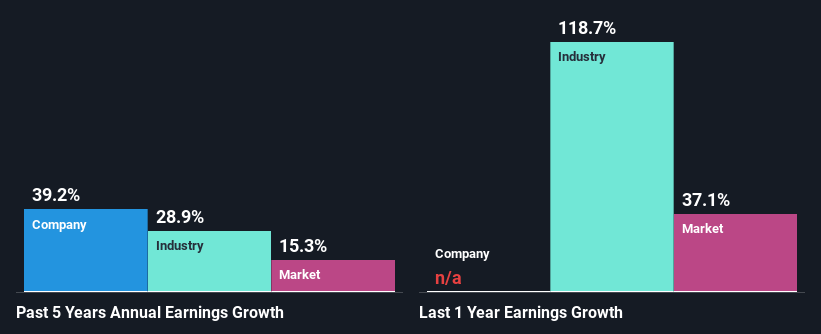
Firstly, we acknowledge that Amerigo Resources has a significantly high ROE. Second, a comparison with the average ROE reported by the industry of 15% also doesn't go unnoticed by us. So, the substantial 39% net income growth seen by Amerigo Resources over the past five years isn't overly surprising.
Next, on comparing with the industry net income growth, we found that Amerigo Resources' growth is quite high when compared to the industry average growth of 29% in the same period, which is great to see.
The basis for attaching value to a company is, to a great extent, tied to its earnings growth. What investors need to determine next is if the expected earnings growth, or the lack of it, is already built into the share price. This then helps them determine if the stock is placed for a bright or bleak future. If you're wondering about Amerigo Resources''s valuation, check out this gauge of its price-to-earnings ratio, as compared to its industry.
Is Amerigo Resources Making Efficient Use Of Its Profits?
Summary
Overall, we are quite pleased with Amerigo Resources' performance. In particular, it's great to see that the company is investing heavily into its business and along with a high rate of return, that has resulted in a sizeable growth in its earnings. Having said that, on studying current analyst estimates, we were concerned to see that while the company has grown its earnings in the past, analysts expect its earnings to shrink in the future. Are these analysts expectations based on the broad expectations for the industry, or on the company's fundamentals? Click here to be taken to our analyst's forecasts page for the company.
Have feedback on this article? Concerned about the content? Get in touch with us directly. Alternatively, email editorial-team (at) simplywallst.com.
This article by Simply Wall St is general in nature. We provide commentary based on historical data and analyst forecasts only using an unbiased methodology and our articles are not intended to be financial advice. It does not constitute a recommendation to buy or sell any stock, and does not take account of your objectives, or your financial situation. We aim to bring you long-term focused analysis driven by fundamental data. Note that our analysis may not factor in the latest price-sensitive company announcements or qualitative material. Simply Wall St has no position in any stocks mentioned.
