
 Yahoo Finance
 Amgen Inc (NASDAQ:AMGN): Time For A Financial Health Check

The size of Amgen Inc (NASDAQ:AMGN), a US$122.46B large-cap, often attracts investors seeking a reliable investment in the stock market. Doing business globally, large caps tend to have diversified revenue streams and attractive capital returns, making them desirable investments for risk-averse portfolios. But, the key to their continued success lies in its financial health. Today we will look at Amgen’s financial liquidity and debt levels, which are strong indicators for whether the company can weather economic downturns or fund strategic acquisitions for future growth. Note that this commentary is very high-level and solely focused on financial health, so I suggest you dig deeper yourself into AMGN here. See our latest analysis for Amgen
How does AMGN’s operating cash flow stack up against its debt?
AMGN has sustained its debt level by about US$35.34B over the last 12 months comprising of short- and long-term debt. At this stable level of debt, the current cash and short-term investment levels stands at US$41.68B for investing into the business. Additionally, AMGN has generated US$11.18B in operating cash flow over the same time period, leading to an operating cash to total debt ratio of 31.63%, indicating that AMGN’s debt is appropriately covered by operating cash. This ratio can also be a sign of operational efficiency as an alternative to return on assets. In AMGN’s case, it is able to generate 0.32x cash from its debt capital.
Does AMGN’s liquid assets cover its short-term commitments?
Looking at AMGN’s most recent US$9.02B liabilities, the company has maintained a safe level of current assets to meet its obligations, with the current ratio last standing at 5.49x. However, anything about 3x may be excessive, since AMGN may be leaving too much capital in low-earning investments.
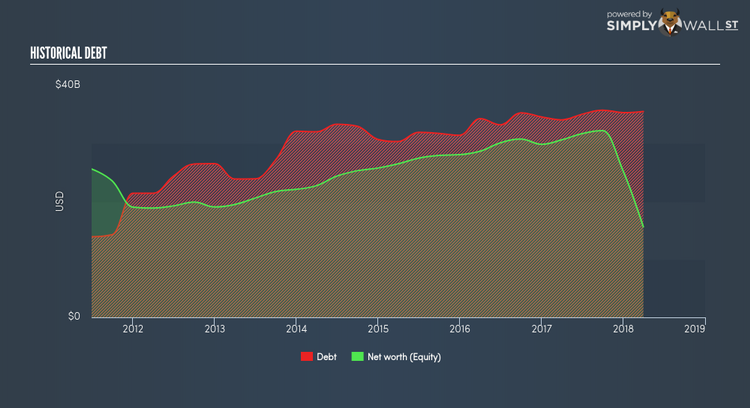
Is AMGN’s debt level acceptable?
Considering Amgen’s total debt outweighs its equity, the company is deemed highly levered. This is not unusual for large-caps since debt tends to be less expensive than equity because interest payments are tax deductible. Accordingly, large companies often have lower cost of capital due to easily obtained financing, providing an advantage over smaller companies. We can put the sustainability of AMGN’s debt levels to the test by looking at how well interest payments are covered by earnings. Ideally, earnings before interest and tax (EBIT) should cover net interest by at least three times. In AMGN’s case, the ratio of 10.55x suggests that interest is comfortably covered. Large-cap investments like AMGN are often believed to be a safe investment due to their ability to pump out ample earnings multiple times its interest payments.
Next Steps:
AMGN’s high cash coverage means that, although its debt levels are high, the company is able to utilise its borrowings efficiently in order to generate cash flow. This may mean this is an optimal capital structure for the business, given that it is also meeting its short-term commitment. This is only a rough assessment of financial health, and I’m sure AMGN has company-specific issues impacting its capital structure decisions. You should continue to research Amgen to get a more holistic view of the large-cap by looking at:
Future Outlook: What are well-informed industry analysts predicting for AMGN’s future growth? Take a look at our free research report of analyst consensus for AMGN’s outlook.
Valuation: What is AMGN worth today? Is the stock undervalued, even when its growth outlook is factored into its intrinsic value? The intrinsic value infographic in our free research report helps visualize whether AMGN is currently mispriced by the market.
Other High-Performing Stocks: Are there other stocks that provide better prospects with proven track records? Explore our free list of these great stocks here.
To help readers see pass the short term volatility of the financial market, we aim to bring you a long-term focused research analysis purely driven by fundamental data. Note that our analysis does not factor in the latest price sensitive company announcements.
The author is an independent contributor and at the time of publication had no position in the stocks mentioned.
