
 Yahoo Finance
 Are Amiad Water Systems Ltd.'s (LON:AFS) Interest Costs Too High?

Want to participate in a research study? Help shape the future of investing tools and earn a $60 gift card!
While small-cap stocks, such as Amiad Water Systems Ltd. (LON:AFS) with its market cap of UK£38m, are popular for their explosive growth, investors should also be aware of their balance sheet to judge whether the company can survive a downturn. Understanding the company's financial health becomes vital, as mismanagement of capital can lead to bankruptcies, which occur at a higher rate for small-caps. The following basic checks can help you get a picture of the company's balance sheet strength. However, these checks don't give you a full picture, so I recommend you dig deeper yourself into AFS here.
AFS’s Debt (And Cash Flows)
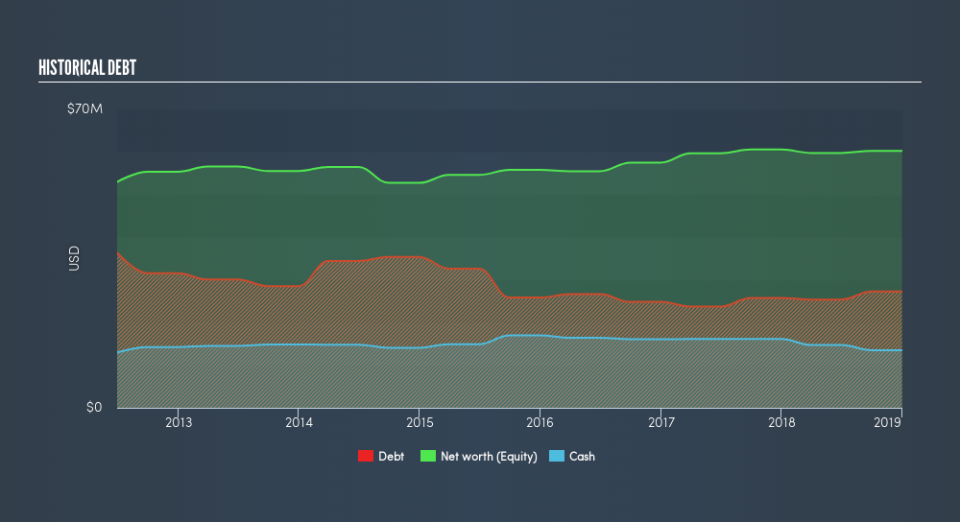
AFS's debt levels surged from US$26m to US$27m over the last 12 months , which accounts for long term debt. With this rise in debt, the current cash and short-term investment levels stands at US$14m , ready to be used for running the business. Moreover, AFS has generated US$136k in operating cash flow during the same period of time, leading to an operating cash to total debt ratio of 0.5%, indicating that AFS’s operating cash is less than its debt.
Can AFS meet its short-term obligations with the cash in hand?
Looking at AFS’s US$43m in current liabilities, the company has been able to meet these commitments with a current assets level of US$87m, leading to a 2.02x current account ratio. The current ratio is calculated by dividing current assets by current liabilities. Usually, for Machinery companies, this is a suitable ratio since there's a sufficient cash cushion without leaving too much capital idle or in low-earning investments.
Is AFS’s debt level acceptable?
With a debt-to-equity ratio of 45%, AFS can be considered as an above-average leveraged company. This is somewhat unusual for small-caps companies, since lenders are often hesitant to provide attractive interest rates to less-established businesses. We can test if AFS’s debt levels are sustainable by measuring interest payments against earnings of a company. Ideally, earnings before interest and tax (EBIT) should cover net interest by at least three times. For AFS, the ratio of 4.71x suggests that interest is appropriately covered, which means that debtors may be willing to loan the company more money, giving AFS ample headroom to grow its debt facilities.
Next Steps:
AFS’s high cash coverage means that, although its debt levels are high, the company is able to utilise its borrowings efficiently in order to generate cash flow. This may mean this is an optimal capital structure for the business, given that it is also meeting its short-term commitment. Keep in mind I haven't considered other factors such as how AFS has been performing in the past. I recommend you continue to research Amiad Water Systems to get a better picture of the small-cap by looking at:
Future Outlook: What are well-informed industry analysts predicting for AFS’s future growth? Take a look at our free research report of analyst consensus for AFS’s outlook.
Valuation: What is AFS worth today? Is the stock undervalued, even when its growth outlook is factored into its intrinsic value? The intrinsic value infographic in our free research report helps visualize whether AFS is currently mispriced by the market.
Other High-Performing Stocks: Are there other stocks that provide better prospects with proven track records? Explore our free list of these great stocks here.
We aim to bring you long-term focused research analysis driven by fundamental data. Note that our analysis may not factor in the latest price-sensitive company announcements or qualitative material.
If you spot an error that warrants correction, please contact the editor at editorial-team@simplywallst.com. This article by Simply Wall St is general in nature. It does not constitute a recommendation to buy or sell any stock, and does not take account of your objectives, or your financial situation. Simply Wall St has no position in the stocks mentioned. Thank you for reading.
