
 Yahoo Finance
 Analysts Expect Star Equity Holdings, Inc. (NASDAQ:STRR) To Breakeven Soon
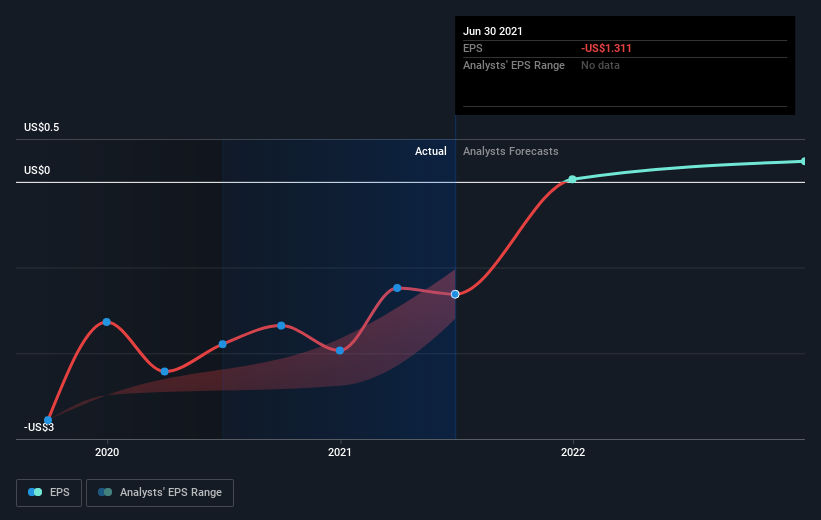
We feel now is a pretty good time to analyse Star Equity Holdings, Inc.'s (NASDAQ:STRR) business as it appears the company may be on the cusp of a considerable accomplishment. Star Equity Holdings, Inc. provides healthcare solutions in the United States and internationally. With the latest financial year loss of US$7.2m and a trailing-twelve-month loss of US$6.4m, the US$14m market-cap company alleviated its loss by moving closer towards its target of breakeven. As path to profitability is the topic on Star Equity Holdings' investors mind, we've decided to gauge market sentiment. We've put together a brief outline of industry analyst expectations for the company, its year of breakeven and its implied growth rate.
Check out our latest analysis for Star Equity Holdings
Consensus from 2 of the American Healthcare analysts is that Star Equity Holdings is on the verge of breakeven. They anticipate the company to incur a final loss in 2020, before generating positive profits of US$200k in 2021. The company is therefore projected to breakeven around a year from now or less! At what rate will the company have to grow in order to realise the consensus estimates forecasting breakeven in under 12 months? Using a line of best fit, we calculated an average annual growth rate of 172%, which is extremely buoyant. Should the business grow at a slower rate, it will become profitable at a later date than expected.
We're not going to go through company-specific developments for Star Equity Holdings given that this is a high-level summary, but, take into account that typically a high growth rate is not out of the ordinary, particularly when a company is in a period of investment.
Before we wrap up, there’s one aspect worth mentioning. The company has managed its capital prudently, with debt making up 30% of equity. This means that it has predominantly funded its operations from equity capital, and its low debt obligation reduces the risk around investing in the loss-making company.
Next Steps:
There are too many aspects of Star Equity Holdings to cover in one brief article, but the key fundamentals for the company can all be found in one place – Star Equity Holdings' company page on Simply Wall St. We've also compiled a list of key factors you should further research:
Valuation: What is Star Equity Holdings worth today? Has the future growth potential already been factored into the price? The intrinsic value infographic in our free research report helps visualize whether Star Equity Holdings is currently mispriced by the market.
Management Team: An experienced management team on the helm increases our confidence in the business – take a look at who sits on Star Equity Holdings’s board and the CEO’s background.
Other High-Performing Stocks: Are there other stocks that provide better prospects with proven track records? Explore our free list of these great stocks here.
This article by Simply Wall St is general in nature. We provide commentary based on historical data and analyst forecasts only using an unbiased methodology and our articles are not intended to be financial advice. It does not constitute a recommendation to buy or sell any stock, and does not take account of your objectives, or your financial situation. We aim to bring you long-term focused analysis driven by fundamental data. Note that our analysis may not factor in the latest price-sensitive company announcements or qualitative material. Simply Wall St has no position in any stocks mentioned.
Have feedback on this article? Concerned about the content? Get in touch with us directly. Alternatively, email editorial-team (at) simplywallst.com.
