
 Yahoo Finance
 Analysts Have Lowered Expectations For GrafTech International Ltd. (NYSE:EAF) After Its Latest Results
Investors in GrafTech International Ltd. (NYSE:EAF) had a good week, as its shares rose 9.2% to close at US$1.42 following the release of its yearly results. It was a pretty bad result overall; while revenues were in line with expectations at US$621m, statutory losses exploded to US$0.99 per share. Following the result, the analysts have updated their earnings model, and it would be good to know whether they think there's been a strong change in the company's prospects, or if it's business as usual. We've gathered the most recent statutory forecasts to see whether the analysts have changed their earnings models, following these results.
See our latest analysis for GrafTech International
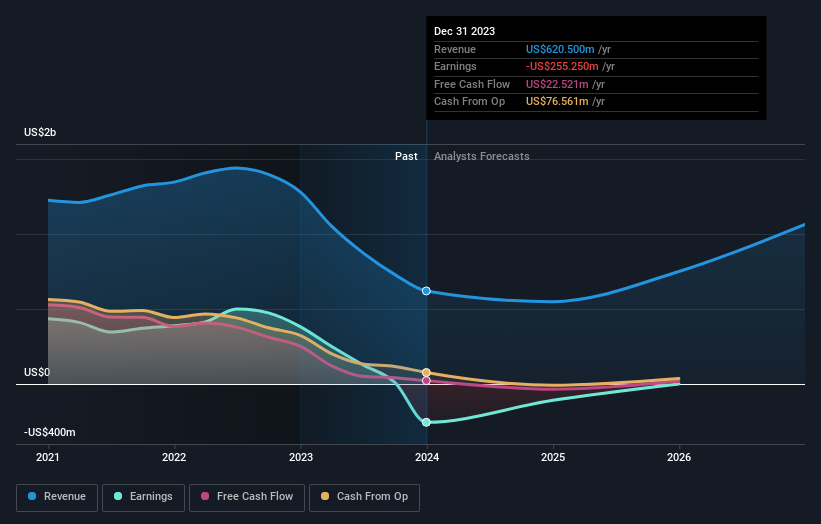
After the latest results, the consensus from GrafTech International's five analysts is for revenues of US$548.9m in 2024, which would reflect an uneasy 12% decline in revenue compared to the last year of performance. The loss per share is expected to greatly reduce in the near future, narrowing 58% to US$0.42. Before this earnings announcement, the analysts had been modelling revenues of US$681.0m and losses of US$0.20 per share in 2024. There's been a definite change in sentiment in this update, with the analysts administering a notable cut to next year's revenue estimates, while at the same time increasing their loss per share forecasts.
The average price target fell 22% to US$1.75, implicitly signalling that lower earnings per share are a leading indicator for GrafTech International's valuation. The consensus price target is just an average of individual analyst targets, so - it could be handy to see how wide the range of underlying estimates is. There are some variant perceptions on GrafTech International, with the most bullish analyst valuing it at US$2.00 and the most bearish at US$1.50 per share. With such a narrow range of valuations, the analysts apparently share similar views on what they think the business is worth.
Another way we can view these estimates is in the context of the bigger picture, such as how the forecasts stack up against past performance, and whether forecasts are more or less bullish relative to other companies in the industry. One thing that stands out from these estimates is that shrinking revenues are expected to moderate over the period ending 2024 compared to the historical decline of 16% per annum over the past five years. By contrast, our data suggests that other companies (with analyst coverage) in a similar industry are forecast to see their revenue grow 7.9% per year. So while a broad number of companies are forecast to grow, unfortunately GrafTech International is expected to see its revenue affected worse than other companies in the industry.
The Bottom Line
The most important thing to note is the forecast of increased losses next year, suggesting all may not be well at GrafTech International. On the negative side, they also downgraded their revenue estimates, and forecasts imply they will perform worse than the wider industry. The consensus price target fell measurably, with the analysts seemingly not reassured by the latest results, leading to a lower estimate of GrafTech International's future valuation.
With that said, the long-term trajectory of the company's earnings is a lot more important than next year. We have estimates - from multiple GrafTech International analysts - going out to 2026, and you can see them free on our platform here.
It is also worth noting that we have found 1 warning sign for GrafTech International that you need to take into consideration.
Have feedback on this article? Concerned about the content? Get in touch with us directly. Alternatively, email editorial-team (at) simplywallst.com.
This article by Simply Wall St is general in nature. We provide commentary based on historical data and analyst forecasts only using an unbiased methodology and our articles are not intended to be financial advice. It does not constitute a recommendation to buy or sell any stock, and does not take account of your objectives, or your financial situation. We aim to bring you long-term focused analysis driven by fundamental data. Note that our analysis may not factor in the latest price-sensitive company announcements or qualitative material. Simply Wall St has no position in any stocks mentioned.
