
 Yahoo Finance
 How Do Analysts See Grainger plc (LON:GRI) Performing Over The Next Few Years?

Want to participate in a short research study? Help shape the future of investing tools and you could win a $250 gift card!
In September 2018, Grainger plc (LON:GRI) released its most recent earnings announcement, which confirmed that the company experienced a strong tailwind, eventuating to a double-digit earnings growth of 19%. Below is a brief commentary on my key takeaways on how market analysts predict Grainger's earnings growth outlook over the next few years and whether the future looks even brighter than the past. Note that I will be looking at net income excluding extraordinary items to get a better understanding of the underlying drivers of earnings.
View our latest analysis for Grainger
Market analysts' prospects for the coming year seems buoyant, with earnings climbing by a robust 19%. This growth seems to continue into the following year with rates reaching double digit 40% compared to today’s earnings, and finally hitting UK£135m by 2022.
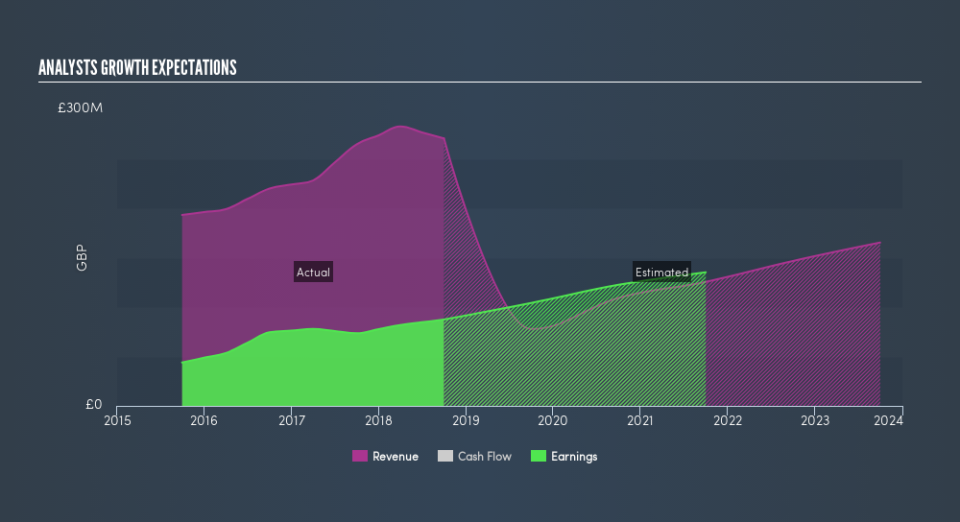
Although it is helpful to understand the growth rate year by year relative to today’s figure, it may be more insightful to analyze the rate at which the business is moving every year, on average. The advantage of this technique is that we can get a better picture of the direction of Grainger's earnings trajectory over the long run, irrespective of near term fluctuations, which may be more relevant for long term investors. To calculate this rate, I've appended a line of best fit through analyst consensus of forecasted earnings. The slope of this line is the rate of earnings growth, which in this case is 14%. This means, we can presume Grainger will grow its earnings by 14% every year for the next few years.
Next Steps:
For Grainger, I've compiled three pertinent factors you should further research:
Financial Health: Does it have a healthy balance sheet? Take a look at our free balance sheet analysis with six simple checks on key factors like leverage and risk.
Management:Have insiders been ramping up their shares to take advantage of the market's sentiment for GRI's future outlook? Check out our management and board analysis with insights on CEO compensation and governance factors.
Other High-Growth Alternatives: Are there other high-growth stocks you could be holding instead of GRI? Explore our interactive list of stocks with large growth potential to get an idea of what else is out there you may be missing!
We aim to bring you long-term focused research analysis driven by fundamental data. Note that our analysis may not factor in the latest price-sensitive company announcements or qualitative material.
If you spot an error that warrants correction, please contact the editor at editorial-team@simplywallst.com. This article by Simply Wall St is general in nature. It does not constitute a recommendation to buy or sell any stock, and does not take account of your objectives, or your financial situation. Simply Wall St has no position in the stocks mentioned. Thank you for reading.
