
 Yahoo Finance
 How Do Analysts See IMI plc (LON:IMI) Performing In The Years Ahead?

The most recent earnings update IMI plc’s (LON:IMI) released in December 2018 revealed that the company gained from a strong tailwind, leading to a double-digit earnings growth of 17%. Below is a brief commentary on my key takeaways on how market analysts predict IMI’s earnings growth trajectory over the next couple of years and whether the future looks even brighter than the past. Note that I will be looking at net income excluding extraordinary items to get a better understanding of the underlying drivers of earnings.
View our latest analysis for IMI
Analysts’ outlook for the coming year seems pessimistic, with earnings decreasing by -2.0%. But in the following year, there is a complete contrast in performance, with reaching double digit 6.2% compared to today’s level and continues to increase to UK£187m in 2022.
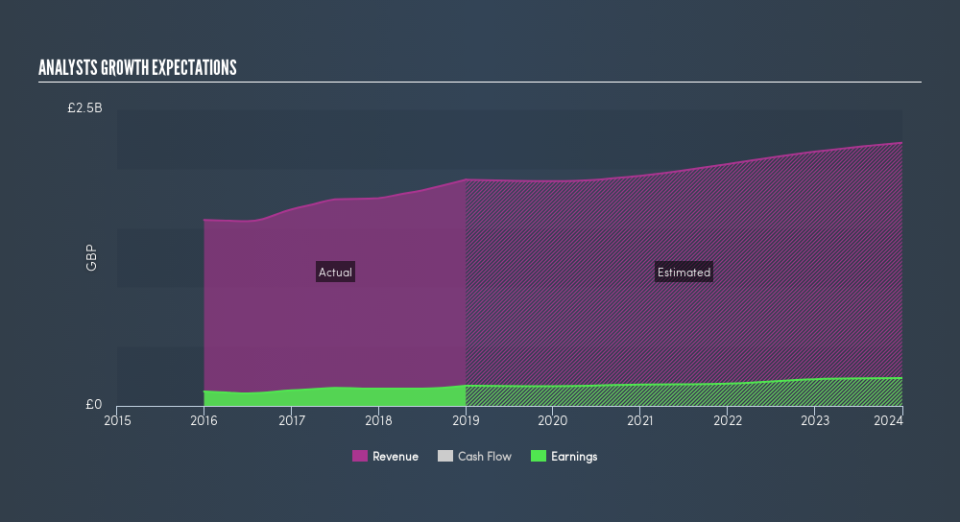
Although it’s helpful to understand the growth rate year by year relative to today’s level, it may be more insightful to estimate the rate at which the company is rising or falling every year, on average. The pro of this approach is that it removes the impact of near term flucuations and accounts for the overarching direction of IMI’s earnings trajectory over time, which may be more relevant for long term investors. To compute this rate, I’ve appended a line of best fit through the forecasted earnings by market analysts. The slope of this line is the rate of earnings growth, which in this case is 5.3%. This means, we can assume IMI will grow its earnings by 5.3% every year for the next couple of years.
Next Steps:
For IMI, there are three relevant factors you should further examine:
Financial Health: Does it have a healthy balance sheet? Take a look at our free balance sheet analysis with six simple checks on key factors like leverage and risk.
Valuation: What is IMI worth today? Is the stock undervalued, even when its growth outlook is factored into its intrinsic value? The intrinsic value infographic in our free research report helps visualize whether IMI is currently mispriced by the market.
Other High-Growth Alternatives: Are there other high-growth stocks you could be holding instead of IMI? Explore our interactive list of stocks with large growth potential to get an idea of what else is out there you may be missing!
We aim to bring you long-term focused research analysis driven by fundamental data. Note that our analysis may not factor in the latest price-sensitive company announcements or qualitative material.
If you spot an error that warrants correction, please contact the editor at editorial-team@simplywallst.com. This article by Simply Wall St is general in nature. It does not constitute a recommendation to buy or sell any stock, and does not take account of your objectives, or your financial situation. Simply Wall St has no position in the stocks mentioned. Thank you for reading.
