
 Yahoo Finance
 How Do Analysts See James Fisher and Sons plc (LON:FSJ) Performing In The Years Ahead?

James Fisher and Sons plc's (LON:FSJ) latest earnings update in December 2018 showed that the company experienced a robust tailwind, leading to a double-digit earnings growth of 15%. Today I want to provide a brief commentary on how market analysts view James Fisher and Sons's earnings growth trajectory over the next few years and whether the future looks even brighter than the past. I will be using net income excluding extraordinary items in order to exclude one-off volatility which I am not interested in.
View our latest analysis for James Fisher and Sons
Analysts' expectations for the coming year seems rather subdued, with earnings growing by a single digit 4.1%. The growth outlook in the following year seems much more optimistic with rates reaching double digit 13% compared to today’s earnings, and finally hitting UK£54m by 2022.
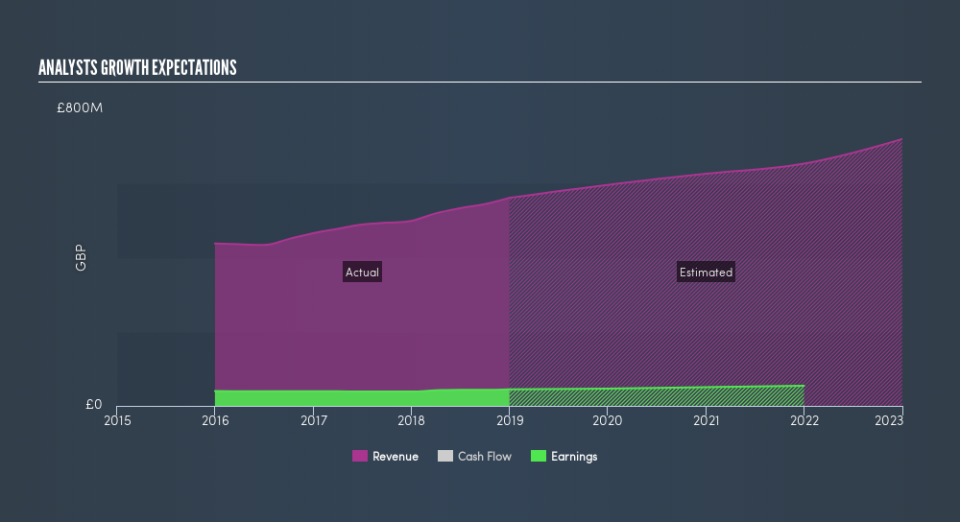
While it’s helpful to be aware of the growth rate year by year relative to today’s level, it may be more valuable to analyze the rate at which the company is rising or falling on average every year. The advantage of this technique is that we can get a bigger picture of the direction of James Fisher and Sons's earnings trajectory over the long run, irrespective of near term fluctuations, which may be more relevant for long term investors. To calculate this rate, I've appended a line of best fit through analyst consensus of forecasted earnings. The slope of this line is the rate of earnings growth, which in this case is 6.6%. This means that, we can assume James Fisher and Sons will grow its earnings by 6.6% every year for the next few years.
Next Steps:
For James Fisher and Sons, there are three fundamental factors you should look at:
Financial Health: Does it have a healthy balance sheet? Take a look at our free balance sheet analysis with six simple checks on key factors like leverage and risk.
Valuation: What is FSJ worth today? Is the stock undervalued, even when its growth outlook is factored into its intrinsic value? The intrinsic value infographic in our free research report helps visualize whether FSJ is currently mispriced by the market.
Other High-Growth Alternatives: Are there other high-growth stocks you could be holding instead of FSJ? Explore our interactive list of stocks with large growth potential to get an idea of what else is out there you may be missing!
We aim to bring you long-term focused research analysis driven by fundamental data. Note that our analysis may not factor in the latest price-sensitive company announcements or qualitative material.
If you spot an error that warrants correction, please contact the editor at editorial-team@simplywallst.com. This article by Simply Wall St is general in nature. It does not constitute a recommendation to buy or sell any stock, and does not take account of your objectives, or your financial situation. Simply Wall St has no position in the stocks mentioned. Thank you for reading.
