
 Yahoo Finance
 How Should You Analyze REIT Stock Mapletree Commercial Trust (SGX:N2IU)?

Want to participate in a short research study? Help shape the future of investing tools and you could win a $250 gift card!
Mapletree Commercial Trust is a S$5.9b mid-cap, real estate investment trust (REIT) based in Singapore, Singapore. REITs own and operate income-generating property and adhere to a different set of regulations. This impacts how N2IU’s business operates and also how we should analyse its stock. In this commentary, I'll take you through some of the things I look at when assessing N2IU.
View our latest analysis for Mapletree Commercial Trust
A common financial term REIT investors should know is Funds from Operations, or FFO for short, which is a REIT's main source of income from its portfolio of property, such as rent. FFO is a cleaner and more representative figure of how much N2IU actually makes from its day-to-day operations, compared to net income, which can be affected by one-off activities or non-cash items such as depreciation. For N2IU, its FFO of S$337m makes up 106% of its gross profit, which means the majority of its earnings are high-quality and recurring.
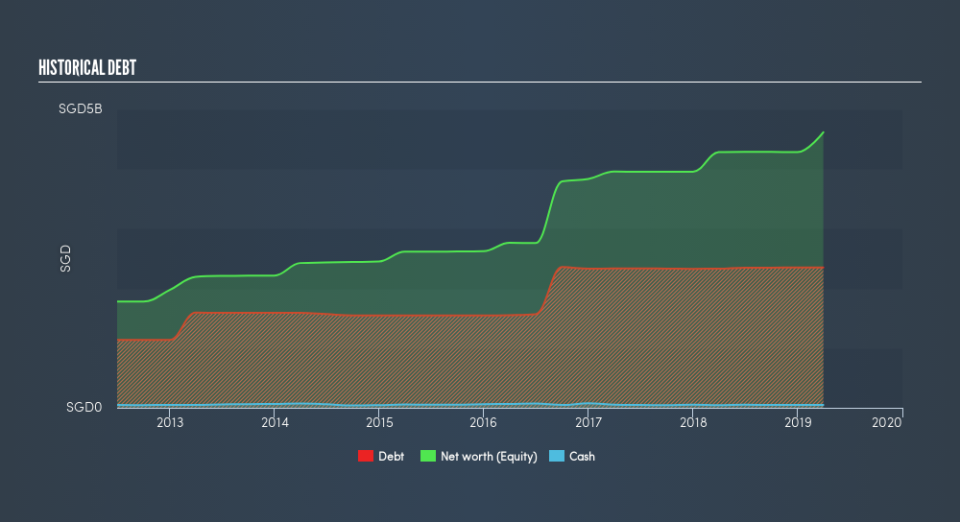
N2IU's financial stability can be gauged by seeing how much its FFO generated each year can cover its total amount of debt. The higher the coverage, the less risky N2IU is, broadly speaking, to have debt on its books. The metric I'll be using, FFO-to-debt, also estimates the time it will take for the company to repay its debt with its FFO. With a ratio of 14%, the credit rating agency Standard & Poor would consider this as significantly high risk. This would take N2IU 6.98 years to pay off using operating income alone. Given that long-term debt is a multi-year commitment this is not unusual, however, the longer it takes for a company to pay back debt, the higher the risk associated with that company.
I also look at N2IU's interest coverage ratio, which demonstrates how many times its earnings can cover its yearly interest expense. This is similar to the concept above, but looks at the upcoming obligations. The ratio is typically calculated using EBIT, but for a REIT stock, it's better to use FFO divided by net interest. With an interest coverage ratio of 4.81x, it’s safe to say N2IU is generating an appropriate amount of cash from its borrowings.
In terms of valuing N2IU, FFO can also be used as a form of relative valuation. Instead of the P/E ratio, P/FFO is used instead, which is very common for REIT stocks. In N2IU’s case its P/FFO is 17.43x, compared to the long-term industry average of 16.5x, meaning that it is fairly valued.
Next Steps:
Mapletree Commercial Trust can bring diversification into your portfolio due to its unique REIT characteristics. Before you make a decision on the stock today, keep in mind I've only covered one metric in this article, the FFO, which is by no means comprehensive. I'd strongly recommend continuing your research on the following areas I believe are key fundamentals for N2IU:
Future Outlook: What are well-informed industry analysts predicting for N2IU’s future growth? Take a look at our free research report of analyst consensus for N2IU’s outlook.
Valuation: What is N2IU worth today? Is the stock undervalued, even when its growth outlook is factored into its intrinsic value? The intrinsic value infographic in our free research report helps visualize whether N2IU is currently mispriced by the market.
Other High-Performing Stocks: Are there other stocks that provide better prospects with proven track records? Explore our free list of these great stocks here.
We aim to bring you long-term focused research analysis driven by fundamental data. Note that our analysis may not factor in the latest price-sensitive company announcements or qualitative material.
If you spot an error that warrants correction, please contact the editor at editorial-team@simplywallst.com. This article by Simply Wall St is general in nature. It does not constitute a recommendation to buy or sell any stock, and does not take account of your objectives, or your financial situation. Simply Wall St has no position in the stocks mentioned. Thank you for reading.
