
 Yahoo Finance
 Anglo Asian Mining PLC (LON:AAZ): Time For A Financial Health Check
Want to participate in a research study? Help shape the future of investing tools and earn a $60 gift card!
While small-cap stocks, such as Anglo Asian Mining PLC (LON:AAZ) with its market cap of UK£79m, are popular for their explosive growth, investors should also be aware of their balance sheet to judge whether the company can survive a downturn. Evaluating financial health as part of your investment thesis is vital, since poor capital management may bring about bankruptcies, which occur at a higher rate for small-caps. The following basic checks can help you get a picture of the company's balance sheet strength. However, this is just a partial view of the stock, and I recommend you dig deeper yourself into AAZ here.
Does AAZ Produce Much Cash Relative To Its Debt?
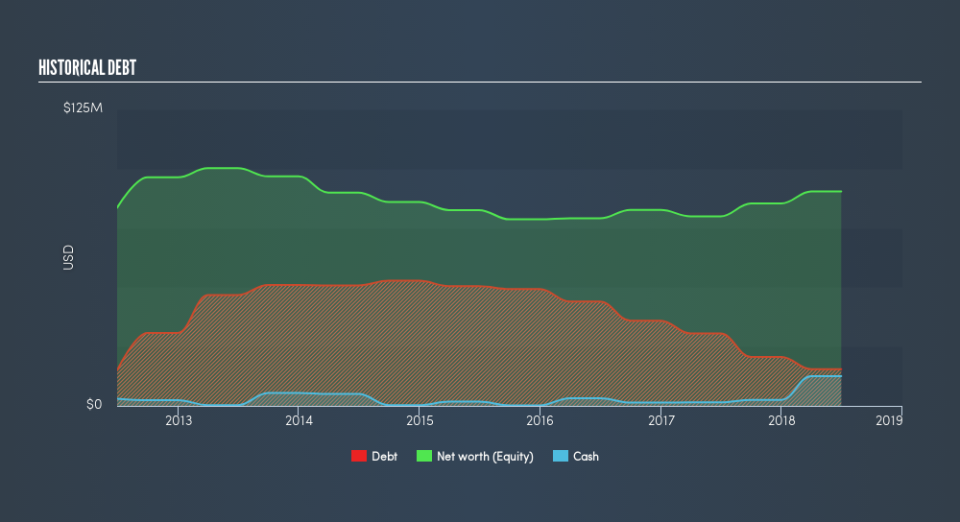
Over the past year, AAZ has reduced its debt from US$31m to US$15m – this includes long-term debt. With this reduction in debt, the current cash and short-term investment levels stands at US$13m to keep the business going. Moreover, AAZ has generated cash from operations of US$44m over the same time period, leading to an operating cash to total debt ratio of 282%, signalling that AAZ’s debt is appropriately covered by operating cash.
Does AAZ’s liquid assets cover its short-term commitments?
Looking at AAZ’s US$34m in current liabilities, it appears that the company has been able to meet these obligations given the level of current assets of US$59m, with a current ratio of 1.71x. The current ratio is calculated by dividing current assets by current liabilities. Generally, for Metals and Mining companies, this is a reasonable ratio since there's a sufficient cash cushion without leaving too much capital idle or in low-earning investments.
Is AAZ’s debt level acceptable?
AAZ’s level of debt is appropriate relative to its total equity, at 17%. AAZ is not taking on too much debt commitment, which can be restrictive and risky for equity-holders. We can check to see whether AAZ is able to meet its debt obligations by looking at the net interest coverage ratio. A company generating earnings before interest and tax (EBIT) at least three times its net interest payments is considered financially sound. In AAZ's, case, the ratio of 8.95x suggests that interest is appropriately covered, which means that lenders may be inclined to lend more money to the company, as it is seen as safe in terms of payback.
Next Steps:
AAZ has demonstrated its ability to generate sufficient levels of cash flow, while its debt hovers at a safe level. Furthermore, the company exhibits proper management of current assets and upcoming liabilities. Keep in mind I haven't considered other factors such as how AAZ has been performing in the past. I recommend you continue to research Anglo Asian Mining to get a better picture of the stock by looking at:
Valuation: What is AAZ worth today? Is the stock undervalued, even when its growth outlook is factored into its intrinsic value? The intrinsic value infographic in our free research report helps visualize whether AAZ is currently mispriced by the market.
Historical Performance: What has AAZ's returns been like over the past? Go into more detail in the past track record analysis and take a look at the free visual representations of our analysis for more clarity.
Other High-Performing Stocks: Are there other stocks that provide better prospects with proven track records? Explore our free list of these great stocks here.
We aim to bring you long-term focused research analysis driven by fundamental data. Note that our analysis may not factor in the latest price-sensitive company announcements or qualitative material.
If you spot an error that warrants correction, please contact the editor at editorial-team@simplywallst.com. This article by Simply Wall St is general in nature. It does not constitute a recommendation to buy or sell any stock, and does not take account of your objectives, or your financial situation. Simply Wall St has no position in the stocks mentioned. Thank you for reading.
