
 Yahoo Finance
 APM Human Services International's (ASX:APM) Returns Have Hit A Wall
If we want to find a potential multi-bagger, often there are underlying trends that can provide clues. Typically, we'll want to notice a trend of growing return on capital employed (ROCE) and alongside that, an expanding base of capital employed. Ultimately, this demonstrates that it's a business that is reinvesting profits at increasing rates of return. In light of that, when we looked at APM Human Services International (ASX:APM) and its ROCE trend, we weren't exactly thrilled.
Understanding Return On Capital Employed (ROCE)
If you haven't worked with ROCE before, it measures the 'return' (pre-tax profit) a company generates from capital employed in its business. To calculate this metric for APM Human Services International, this is the formula:
Return on Capital Employed = Earnings Before Interest and Tax (EBIT) ÷ (Total Assets - Current Liabilities)
0.052 = AU$121m ÷ (AU$2.7b - AU$364m) (Based on the trailing twelve months to June 2022).
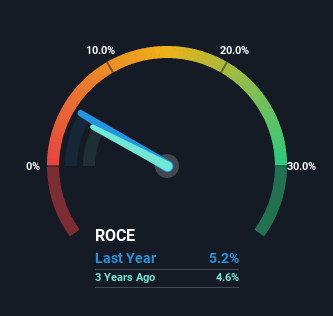
So, APM Human Services International has an ROCE of 5.2%. In absolute terms, that's a low return and it also under-performs the Professional Services industry average of 13%.
See our latest analysis for APM Human Services International
Above you can see how the current ROCE for APM Human Services International compares to its prior returns on capital, but there's only so much you can tell from the past. If you're interested, you can view the analysts predictions in our free report on analyst forecasts for the company.
So How Is APM Human Services International's ROCE Trending?
In terms of APM Human Services International's historical ROCE trend, it doesn't exactly demand attention. The company has employed 255% more capital in the last three years, and the returns on that capital have remained stable at 5.2%. This poor ROCE doesn't inspire confidence right now, and with the increase in capital employed, it's evident that the business isn't deploying the funds into high return investments.
On a side note, APM Human Services International has done well to reduce current liabilities to 14% of total assets over the last three years. This can eliminate some of the risks inherent in the operations because the business has less outstanding obligations to their suppliers and or short-term creditors than they did previously.
In Conclusion...
In summary, APM Human Services International has simply been reinvesting capital and generating the same low rate of return as before. Unsurprisingly then, the total return to shareholders over the last year has been flat. All in all, the inherent trends aren't typical of multi-baggers, so if that's what you're after, we think you might have more luck elsewhere.
If you want to continue researching APM Human Services International, you might be interested to know about the 1 warning sign that our analysis has discovered.
If you want to search for solid companies with great earnings, check out this free list of companies with good balance sheets and impressive returns on equity.
Have feedback on this article? Concerned about the content? Get in touch with us directly. Alternatively, email editorial-team (at) simplywallst.com.
This article by Simply Wall St is general in nature. We provide commentary based on historical data and analyst forecasts only using an unbiased methodology and our articles are not intended to be financial advice. It does not constitute a recommendation to buy or sell any stock, and does not take account of your objectives, or your financial situation. We aim to bring you long-term focused analysis driven by fundamental data. Note that our analysis may not factor in the latest price-sensitive company announcements or qualitative material. Simply Wall St has no position in any stocks mentioned.
Join A Paid User Research Session
You’ll receive a US$30 Amazon Gift card for 1 hour of your time while helping us build better investing tools for the individual investors like yourself. Sign up here
