
 Yahoo Finance
 Is Applied Materials, Inc.'s (NASDAQ:AMAT) Balance Sheet A Threat To Its Future?

Want to participate in a research study? Help shape the future of investing tools and earn a $60 gift card!
The size of Applied Materials, Inc. (NASDAQ:AMAT), a US$40b large-cap, often attracts investors seeking a reliable investment in the stock market. Doing business globally, large caps tend to have diversified revenue streams and attractive capital returns, making them desirable investments for risk-averse portfolios. However, its financial health remains the key to continued success. This article will examine Applied Materials’s financial liquidity and debt levels to get an idea of whether the company can deal with cyclical downturns and maintain funds to accommodate strategic spending for future growth. Note that this commentary is very high-level and solely focused on financial health, so I suggest you dig deeper yourself into AMAT here.
Check out our latest analysis for Applied Materials
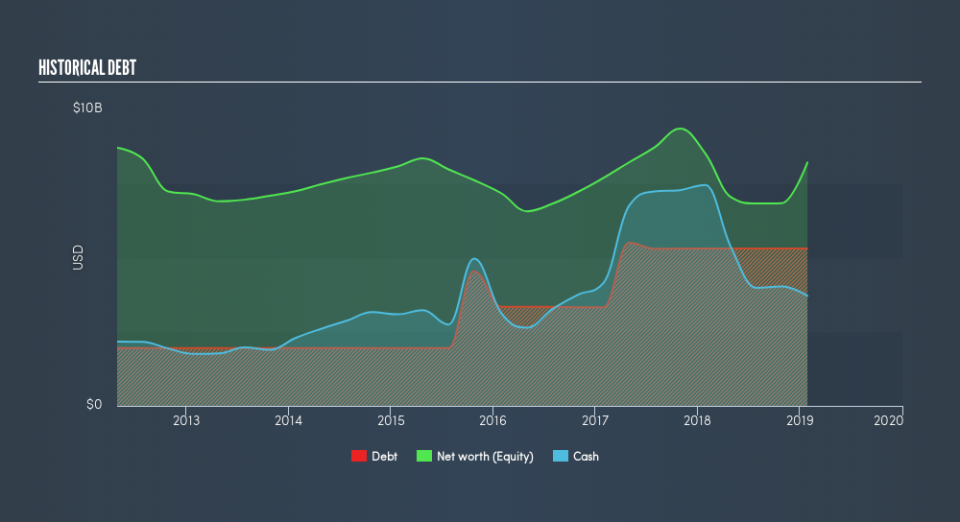
AMAT’s Debt (And Cash Flows)
AMAT has sustained its debt level by about US$5.3b over the last 12 months which accounts for long term debt. At this current level of debt, AMAT's cash and short-term investments stands at US$3.7b , ready to be used for running the business. Additionally, AMAT has produced US$3.2b in operating cash flow in the last twelve months, leading to an operating cash to total debt ratio of 59%, signalling that AMAT’s current level of operating cash is high enough to cover debt.
Does AMAT’s liquid assets cover its short-term commitments?
Looking at AMAT’s US$3.8b in current liabilities, it seems that the business has been able to meet these obligations given the level of current assets of US$10b, with a current ratio of 2.72x. The current ratio is calculated by dividing current assets by current liabilities. Usually, for Semiconductor companies, this is a suitable ratio since there's a sufficient cash cushion without leaving too much capital idle or in low-earning investments.
Can AMAT service its debt comfortably?
With debt reaching 65% of equity, AMAT may be thought of as relatively highly levered. This isn’t surprising for large-caps, as equity can often be more expensive to issue than debt, plus interest payments are tax deductible. Accordingly, large companies often have an advantage over small-caps through lower cost of capital due to cheaper financing. We can test if AMAT’s debt levels are sustainable by measuring interest payments against earnings of a company. As a rule of thumb, a company should have earnings before interest and tax (EBIT) of at least three times the size of net interest. For AMAT, the ratio of 36.8x suggests that interest is comfortably covered. High interest coverage serves as an indication of the safety of a company, which highlights why many large organisations like AMAT are considered a risk-averse investment.
Next Steps:
Although AMAT’s debt level is towards the higher end of the spectrum, its cash flow coverage seems adequate to meet obligations which means its debt is being efficiently utilised. Since there is also no concerns around AMAT's liquidity needs, this may be its optimal capital structure for the time being. This is only a rough assessment of financial health, and I'm sure AMAT has company-specific issues impacting its capital structure decisions. I suggest you continue to research Applied Materials to get a more holistic view of the large-cap by looking at:
Future Outlook: What are well-informed industry analysts predicting for AMAT’s future growth? Take a look at our free research report of analyst consensus for AMAT’s outlook.
Valuation: What is AMAT worth today? Is the stock undervalued, even when its growth outlook is factored into its intrinsic value? The intrinsic value infographic in our free research report helps visualize whether AMAT is currently mispriced by the market.
Other High-Performing Stocks: Are there other stocks that provide better prospects with proven track records? Explore our free list of these great stocks here.
We aim to bring you long-term focused research analysis driven by fundamental data. Note that our analysis may not factor in the latest price-sensitive company announcements or qualitative material.
If you spot an error that warrants correction, please contact the editor at editorial-team@simplywallst.com. This article by Simply Wall St is general in nature. It does not constitute a recommendation to buy or sell any stock, and does not take account of your objectives, or your financial situation. Simply Wall St has no position in the stocks mentioned. Thank you for reading.
