
 Yahoo Finance
 Is ArcelorMittal (AMS:MT) A Smart Choice For Dividend Investors?

Today we'll take a closer look at ArcelorMittal (AMS:MT) from a dividend investor's perspective. Owning a strong business and reinvesting the dividends is widely seen as an attractive way of growing your wealth. Unfortunately, it's common for investors to be enticed in by the seemingly attractive yield, and lose money when the company has to cut its dividend payments.
A 2.9% yield is nothing to get excited about, but investors probably think the long payment history suggests ArcelorMittal has some staying power. The company also returned around 0.9% of its market capitalisation to shareholders in the form of stock buybacks over the past year. Remember that the recent share price drop will make ArcelorMittal's yield look higher, even though recent events might have impacted the company's prospects. There are a few simple ways to reduce the risks of buying ArcelorMittal for its dividend, and we'll go through these below.
Click the interactive chart for our full dividend analysis
Payout ratios
Dividends are usually paid out of company earnings. If a company is paying more than it earns, then the dividend might become unsustainable - hardly an ideal situation. Comparing dividend payments to a company's net profit after tax is a simple way of reality-checking whether a dividend is sustainable. Although it reported a loss over the past 12 months, ArcelorMittal currently pays a dividend. When a company is loss-making, we next need to check to see if its cash flows can support the dividend.
ArcelorMittal paid out 8.3% of its free cash flow as dividends last year, which is conservative and suggests the dividend is sustainable.
Is ArcelorMittal's Balance Sheet Risky?
Given ArcelorMittal is paying a dividend but reported a loss over the past year, we need to check its balance sheet for signs of financial distress. A rough way to check this is with these two simple ratios: a) net debt divided by EBITDA (earnings before interest, tax, depreciation and amortisation), and b) net interest cover. Net debt to EBITDA measures total debt load relative to company earnings (lower = less debt), while net interest cover measures the ability to pay interest on the debt (higher = greater ability to pay interest costs). ArcelorMittal has net debt of 2.31 times its EBITDA. Using debt can accelerate business growth, but also increases the risks.
Net interest cover can be calculated by dividing earnings before interest and tax (EBIT) by the company's net interest expense. Interest cover of 1.47 times its interest expense is starting to become a concern for ArcelorMittal, and be aware that lenders may place additional restrictions on the company as well.
We update our data on ArcelorMittal every 24 hours, so you can always get our latest analysis of its financial health, here.
Dividend Volatility
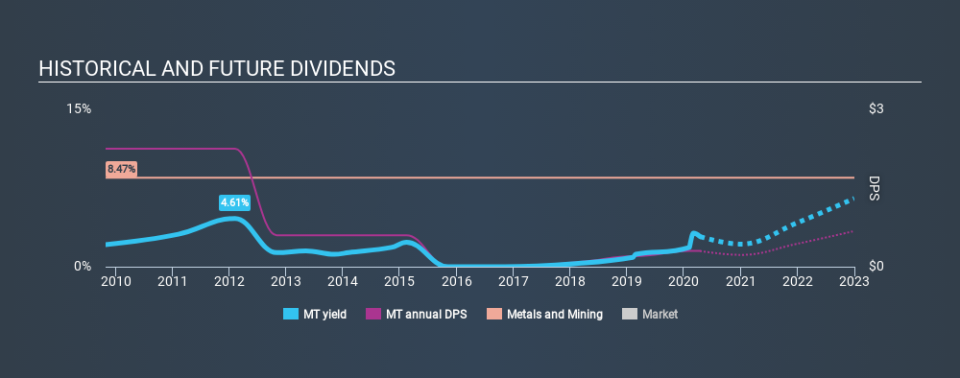
One of the major risks of relying on dividend income, is the potential for a company to struggle financially and cut its dividend. Not only is your income cut, but the value of your investment declines as well - nasty. ArcelorMittal has been paying dividends for a long time, but for the purpose of this analysis, we only examine the past 10 years of payments. Its dividend payments have declined on at least one occasion over the past ten years. During the past ten-year period, the first annual payment was US$2.25 in 2010, compared to US$0.30 last year. The dividend has fallen 87% over that period.
When a company's per-share dividend falls we question if this reflects poorly on either external business conditions, or the company's capital allocation decisions. Either way, we find it hard to get excited about a company with a declining dividend.
Dividend Growth Potential
With a relatively unstable dividend, and a poor history of shrinking dividends, it's even more important to see if EPS are growing. Strong earnings per share (EPS) growth might encourage our interest in the company despite fluctuating dividends, which is why it's great to see ArcelorMittal has grown its earnings per share at 44% per annum over the past five years.
Conclusion
When we look at a dividend stock, we need to form a judgement on whether the dividend will grow, if the company is able to maintain it in a wide range of economic circumstances, and if the dividend payout is sustainable. We're not keen on the fact that ArcelorMittal paid dividends despite reporting a loss over the past year, although fortunately its dividend was covered by cash flow. We were also glad to see it growing earnings, but it was concerning to see the dividend has been cut at least once in the past. Ultimately, ArcelorMittal comes up short on our dividend analysis. It's not that we think it is a bad company - just that there are likely more appealing dividend prospects out there on this analysis.
Market movements attest to how highly valued a consistent dividend policy is compared to one which is more unpredictable. Meanwhile, despite the importance of dividend payments, they are not the only factors our readers should know when assessing a company. As an example, we've identified 2 warning signs for ArcelorMittal that you should be aware of before investing.
We have also put together a list of global stocks with a market capitalisation above $1bn and yielding more 3%.
If you spot an error that warrants correction, please contact the editor at editorial-team@simplywallst.com. This article by Simply Wall St is general in nature. It does not constitute a recommendation to buy or sell any stock, and does not take account of your objectives, or your financial situation. Simply Wall St has no position in the stocks mentioned.
We aim to bring you long-term focused research analysis driven by fundamental data. Note that our analysis may not factor in the latest price-sensitive company announcements or qualitative material. Thank you for reading.
