
 Yahoo Finance
 Are Consumer Stocks Signaling Risk-On?

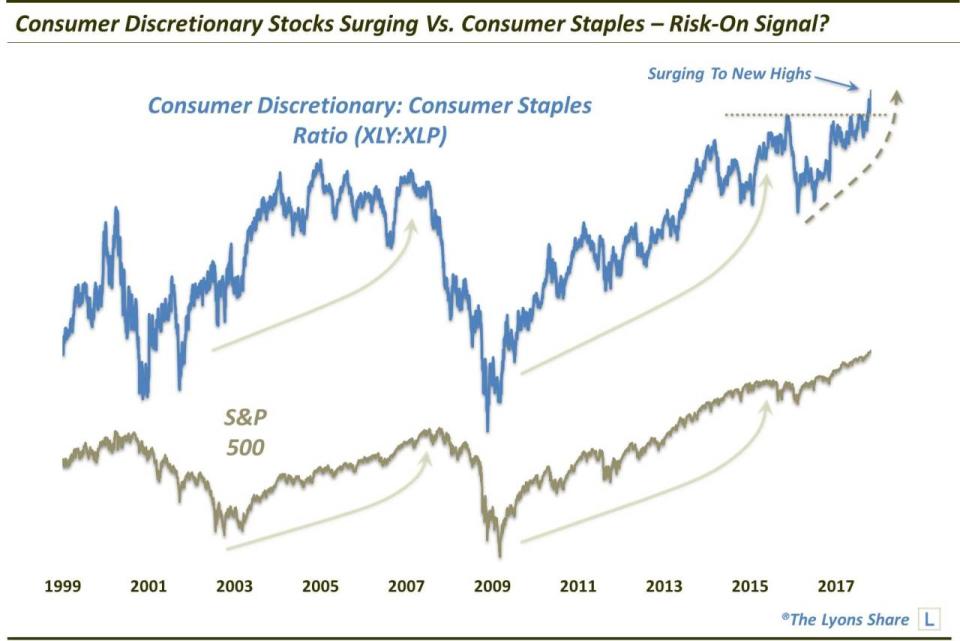
Is the surge in consumer discretionary stocks versus consumer staples sending a risk-on signal for stocks?
When considering the quality of a stock market rally, we have a set of various “risk-on vs. risk-off” indicators that help us determine the rally’s legitimacy. That is, how much support is behind the advance and how likely is it to continue? Much of the focus of these indicators is based on having the “right” stocks leading the way. Certain segments of the market are historically associated with robust and sustainable risk-on moves. Some of these indicators measure one segment relative to another. Such is the case with today’s Chart Of The Day looking at the performance of consumer discretionary stocks versus consumer staples.
Historically, it has been bullish for the overall market when consumer discretionary stocks are leading consumer staples – and vice versa. This makes sense as it relates to the economic cycle during bull vs. bear markets, not that the economy necessarily has to move in lock-step with the stock market. However, simply by looking at a chart ratio of the performance of consumer discretionary stocks versus consumer staples, one can easily see the correlation between the trajectory of the ratio and that of the S&P 500. In other words, when the performance ratio of discretionary stocks to staples is rising, the S&P 500 typically does well; when the ratio is declining, the S&P 500 has struggled.
This correlation may be good news right now for stock bulls. That’s because the consumer discretionary:staples ratio, as measured by the Consumer Discretionary SPDR ETF (XLY) relative to the Consumer Staples SPDR ETF (XLP) is surging right now, to all-time highs.
So, is this a clear-cut risk-on signal for investors? Traditionally, that has been the case in such conditions. However, one potential fly in the ointment may be found in the weighting of the aforementioned funds. Specifically, XLY and XLP are cap-weighted funds. Therefore, it is possible that a fund’s performance is being unduly impacted by a small number of stocks – or A stock – rather than representing strength in the overall sector.
Now, you probably know where I’m going with this – Amazon (AMZN). The stock of Amazon carries a full 15% weighting in the XLY. And given the stock’s exploits of late, it may be resulting in a better appearance of the above ratio than the actual reality. This is a legitimate point.
So is Amazon exerting undue influence on this indicator or is the message as straightforward as the chart above? Certainly Amazon has had a nice run in recent years. And it has played an inordinately large role in generally placing the ratio in as favorable a position as it is in now. And certainly today’s 100-plus point gain in AMZN stock has further aided the situation.
That said, prior to today, AMZN’s stock had actually been in a rut, essentially running in place for the past 6 months. Despite that, the XLY:XLP ratio had maintained its position near its all-time highs, allowing for the eventual surge to new highs that we are presently witnessing. So, we can’t say that it is all Amazon.
But how much can be attributed to Amazon – and some of the other mega-caps in the XLY, for that matter? Is the surging risk-on signal legitimate, or a mirage? In a Premium Post on The Lyons Share, we look at a measure that helps us determine the true status of the strength in consumer discretionary stocks versus consumer staples, and the true signal being sent – risk-on or risk-off.
If you’re interested in the “all-access” version of our charts and research, please check out our new site, The Lyons Share. Considering what we believe will be a very difficult investment climate for perhaps years to come, there has never been a better time to reap the benefits of our risk-managed approach. Thanks for reading!
_____________
Disclaimer: JLFMI’s actual investment decisions are based on our proprietary models. The conclusions based on the study in this letter may or may not be consistent with JLFMI’s actual investment posture at any given time. Additionally, the commentary provided here is for informational purposes only and should not be taken as a recommendation to invest in any specific securities or according to any specific methodologies. Proper due diligence should be performed before investing in any investment vehicle. There is a risk of loss involved in all investments.
