
 Yahoo Finance
 Arrow Global Group (LON:ARW) Shareholders Booked A 52% Gain In The Last Year

Passive investing in index funds can generate returns that roughly match the overall market. But investors can boost returns by picking market-beating companies to own shares in. To wit, the Arrow Global Group PLC (LON:ARW) share price is 52% higher than it was a year ago, much better than the market return of around 17% (not including dividends) in the same period. That's a solid performance by our standards! On the other hand, longer term shareholders have had a tougher run, with the stock falling 10% in three years.
Check out our latest analysis for Arrow Global Group
To paraphrase Benjamin Graham: Over the short term the market is a voting machine, but over the long term it's a weighing machine. One flawed but reasonable way to assess how sentiment around a company has changed is to compare the earnings per share (EPS) with the share price.
During the last year, Arrow Global Group actually saw its earnings per share drop 11%.
This means it's unlikely the market is judging the company based on earnings growth. Since the change in EPS doesn't seem to correlate with the change in share price, it's worth taking a look at other metrics.
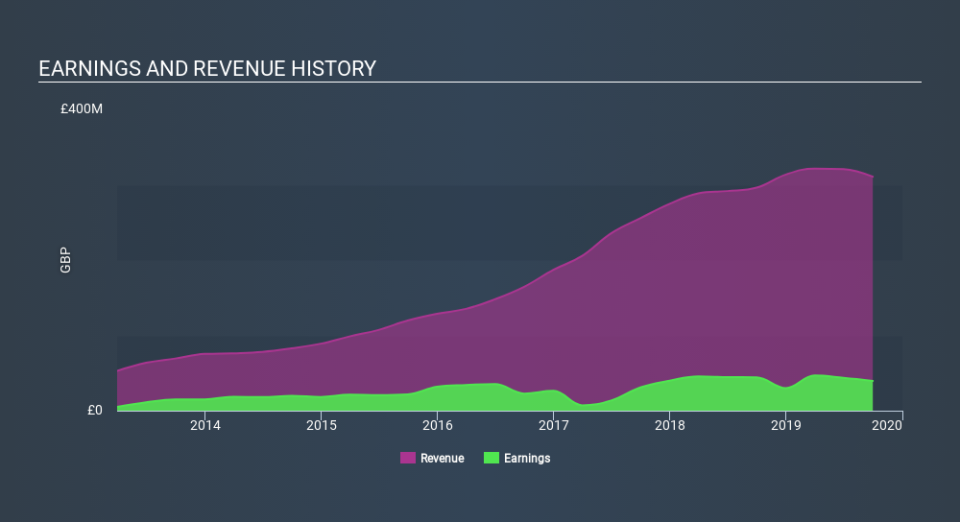
Absent any improvement, we don't think a thirst for dividends is pushing up the Arrow Global Group's share price. It seems far more likely that the 4.9% boost to the revenue over the last year, is making the difference. After all, it's not necessarily a bad thing if a business sacrifices profits today in pursuit of profit tomorrow (metaphorically speaking).
You can see how earnings and revenue have changed over time in the image below (click on the chart to see the exact values).
If you are thinking of buying or selling Arrow Global Group stock, you should check out this FREE detailed report on its balance sheet.
What About Dividends?
It is important to consider the total shareholder return, as well as the share price return, for any given stock. The TSR is a return calculation that accounts for the value of cash dividends (assuming that any dividend received was reinvested) and the calculated value of any discounted capital raisings and spin-offs. It's fair to say that the TSR gives a more complete picture for stocks that pay a dividend. As it happens, Arrow Global Group's TSR for the last year was 62%, which exceeds the share price return mentioned earlier. The dividends paid by the company have thusly boosted the total shareholder return.
A Different Perspective
We're pleased to report that Arrow Global Group shareholders have received a total shareholder return of 62% over one year. Of course, that includes the dividend. That's better than the annualised return of 7.6% over half a decade, implying that the company is doing better recently. In the best case scenario, this may hint at some real business momentum, implying that now could be a great time to delve deeper. Before spending more time on Arrow Global Group it might be wise to click here to see if insiders have been buying or selling shares.
If you would prefer to check out another company -- one with potentially superior financials -- then do not miss this free list of companies that have proven they can grow earnings.
Please note, the market returns quoted in this article reflect the market weighted average returns of stocks that currently trade on GB exchanges.
If you spot an error that warrants correction, please contact the editor at editorial-team@simplywallst.com. This article by Simply Wall St is general in nature. It does not constitute a recommendation to buy or sell any stock, and does not take account of your objectives, or your financial situation. Simply Wall St has no position in the stocks mentioned.
We aim to bring you long-term focused research analysis driven by fundamental data. Note that our analysis may not factor in the latest price-sensitive company announcements or qualitative material. Thank you for reading.
