
 Yahoo Finance
 Arthur J. Gallagher (AJG) Q1 Earnings Beat, Revenues Rise Y/Y
Arthur J. Gallagher & Co. AJG reported first-quarter 2024 adjusted net earnings of $3.49 per share, which beat the Zacks Consensus Estimate by 2.6%. Moreover, the bottom line increased 15.5% on a year-over-year basis.
Total revenues were $3.2 billion, up 20.3% year over year, primarily driven by higher commissions, fees and supplemental, contingent revenues and interest income, premium finance revenues, and other income. Moreover, the top line beat the Zacks Consensus Estimate by 2%.
The quarter’s results overall benefited from higher adjusted revenues and adjusted EBITDAC across the Brokerage and Risk Management segments, partially offset by higher expenses.
Arthur J. Gallagher & Co. Price, Consensus and EPS Surprise
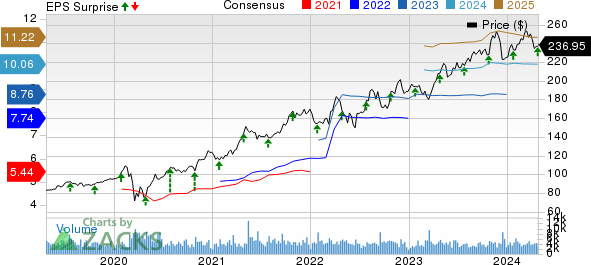
Arthur J. Gallagher & Co. price-consensus-eps-surprise-chart | Arthur J. Gallagher & Co. Quote
Operational Update
Arthur J. Gallagher’s total expense increased 18.3% year over year to $2.4 billion, attributed to higher compensation, higher operating cost, reimbursements, and higher interest, depreciation and amortization.
Adjusted earnings before interest, tax, depreciation, amortization and change in estimated acquisition earnout payables (EBITDAC) grew 20.7% from the prior-year quarter to $1 billion.
Segment Results
Brokerage: Adjusted revenues of $2.8 billion increased 19.2% year over year on higher commissions, fees, supplemental revenues, contingent revenues, interest income, premium finance revenues and other income. This metric missed the Zacks Consensus Estimate by 1.3%.
Adjusted EBITDAC climbed 18.2% from the prior-year quarter to $1.1 billion while the margin contracted 30 basis points (bps) to 39.9%. Adjusted EBITDAC for the quarter beat the Zacks Consensus Estimate by 0.8%.
Expenses increased 18% to $1.9 billion, driven by higher compensation, operating, depreciation and amortization.
Risk Management: Adjusted revenues were up 19% year over year to $353 million on higher fees and interest income, and other income. However, the metric missed the Zacks Consensus Estimate by 7.1%.
Adjusted EBITDAC increased 27.8% year over year to $72.7 million, while the margin expanded 140 bps to 20.6%. Adjusted EBITDAC for the quarter beat the Zacks Consensus Estimate by 7.3%.
Expenses increased 18.5% to $338.2 million because of higher compensation, operating cost, reimbursements, and depreciation and amortization.
Corporate: EBITDAC was negative $59.5 million compared with negative $57.2 million in the year-ago quarter.
Financial Update
As of Mar 31, 2024, total assets were $60.9 billion, which increased 18.1% from 2023-end.
As of Mar 31, 2024, cash and cash equivalents increased 81.4% to $1.7 billion from 2023-end.
Shareholders’ equity increased 4.8% to $11.3 billion as of Mar 31, 2024, from Dec 31, 2023.
Acquisition Update
In the reported quarter, the company closed 12 acquisitions with estimated annualized revenues of $69.2 million.
Zacks Rank
Currently, Arthur J. Gallagher carries a Zacks Rank #3 (Hold). You can see the complete list of today’s Zacks #1 Rank (Strong Buy) stocks here.
Performance of Other Insurance-Brokerage Players
Brown & Brown, Inc.’s BRO first-quarter 2024 adjusted earnings of $1.14 per share beat the Zacks Consensus Estimate by 6.5%. The bottom line increased 18.7% year over year. Total revenues of $1.25 billion beat the Zacks Consensus Estimate by 3.8%. The top line improved 12.7% year over year. The upside can be primarily attributed to commission and fees, which grew 11.6% year over year to $1.2 million. The Zacks Consensus Estimate for commission and fees was pegged at $1.1 billion.
Organic revenues improved 8.6% to $1.15 billion in the quarter under review. Investment income more than doubled year over year to $18 million. The Zacks Consensus Estimate for the metric was pegged at $17.3 million. Adjusted EBITDAC was $466 million, up 17.1% year over year. EBITDAC margin increased to 37% year over year from 35.7%. Total expenses increased 8.7% to $894 million.
Willis Towers Watson Public Limited Company WTW delivered first-quarter 2024 adjusted earnings of $3.29 per share, which beat the Zacks Consensus Estimate by 2.5%. The bottom line improved 15.8% year over year. Willis Towers posted adjusted consolidated revenues of $2.3 billion, up 4% year over year on a reported basis. Revenues increased 5% on an organic basis and 4% on a constant currency basis. The top line missed the Zacks Consensus Estimate by 0.8%.
The total costs of providing services increased 5.2% year over year to $2 billion. The figure matched our estimate. Adjusted operating income was $483 million, up 16% year over year. Adjusted operating margin expanded 200 basis points (bps) to 20.6%. Adjusted EBITDA was $568 million, up 13% year over year. Adjusted EBITDA margin was 24.3%, which expanded 190 bps.
Marsh & McLennan Companies, Inc. MMC reported first-quarter 2024 adjusted earnings per share of $2.89, which surpassed the Zacks Consensus Estimate by 3.6%. The bottom line improved 14% year over year. Its shares gained 2.7% in the pre-market trading session to reflect the outperformance. Consolidated revenues of $6.5 billion advanced 9% year over year in the quarter under review. The figure also rose 9% on an underlying basis. Also, the top line beat the consensus mark by 1.5%.
Total operating expenses escalated 8.3% year over year to $4.5 billion in the first quarter, which matched our estimate. The year-over-year increase was due to higher compensation and benefit costs. The Risk and Insurance Services segment’s expenses rose 7.8% year over year, whereas the Consulting segment witnessed a 10% year-over-year increase. MMC’s adjusted operating income grew 11% year over year to $2 billion, higher than our estimate of $1.9 billion. Adjusted operating margin of 32% improved 80 basis points (bps) year over year.
Want the latest recommendations from Zacks Investment Research? Today, you can download 7 Best Stocks for the Next 30 Days. Click to get this free report
Marsh & McLennan Companies, Inc. (MMC) : Free Stock Analysis Report
Arthur J. Gallagher & Co. (AJG) : Free Stock Analysis Report
Brown & Brown, Inc. (BRO) : Free Stock Analysis Report
Willis Towers Watson Public Limited Company (WTW) : Free Stock Analysis Report
