
 Yahoo Finance
 ASM International (AMS:ASM) Has Gifted Shareholders With A Fantastic 177% Total Return On Their Investment

While ASM International NV (AMS:ASM) shareholders are probably generally happy, the stock hasn't had particularly good run recently, with the share price falling 17% in the last quarter. But that doesn't change the fact that shareholders have received really good returns over the last five years. Indeed, the share price is up an impressive 132% in that time. To some, the recent pullback wouldn't be surprising after such a fast rise. The more important question is whether the stock is too cheap or too expensive today.
See our latest analysis for ASM International
While the efficient markets hypothesis continues to be taught by some, it has been proven that markets are over-reactive dynamic systems, and investors are not always rational. One imperfect but simple way to consider how the market perception of a company has shifted is to compare the change in the earnings per share (EPS) with the share price movement.
Over half a decade, ASM International managed to grow its earnings per share at 21% a year. This EPS growth is reasonably close to the 18% average annual increase in the share price. This indicates that investor sentiment towards the company has not changed a great deal. Indeed, it would appear the share price is reacting to the EPS.
The company's earnings per share (over time) is depicted in the image below (click to see the exact numbers).
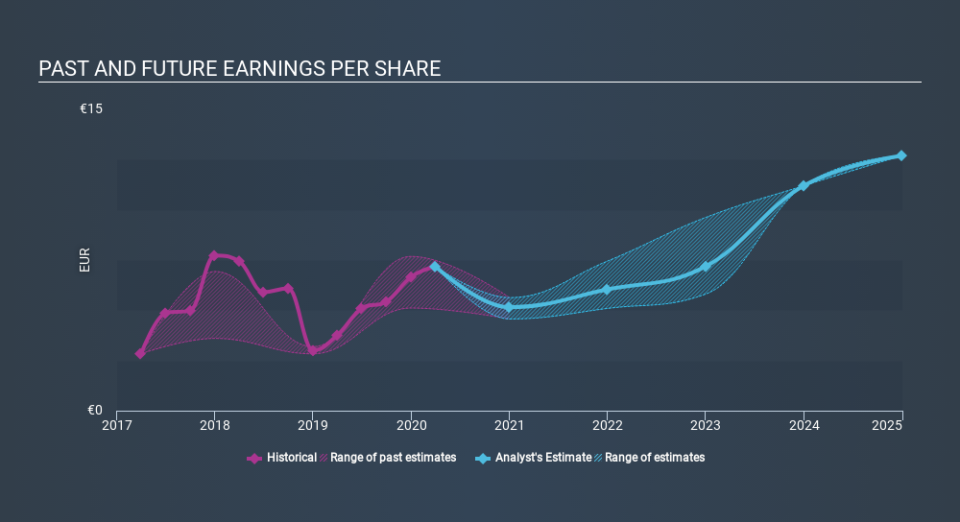
It's good to see that there was some significant insider buying in the last three months. That's a positive. On the other hand, we think the revenue and earnings trends are much more meaningful measures of the business. Before buying or selling a stock, we always recommend a close examination of historic growth trends, available here..
What About Dividends?
As well as measuring the share price return, investors should also consider the total shareholder return (TSR). The TSR incorporates the value of any spin-offs or discounted capital raisings, along with any dividends, based on the assumption that the dividends are reinvested. It's fair to say that the TSR gives a more complete picture for stocks that pay a dividend. We note that for ASM International the TSR over the last 5 years was 177%, which is better than the share price return mentioned above. The dividends paid by the company have thusly boosted the total shareholder return.
A Different Perspective
It's good to see that ASM International has rewarded shareholders with a total shareholder return of 88% in the last twelve months. And that does include the dividend. Since the one-year TSR is better than the five-year TSR (the latter coming in at 23% per year), it would seem that the stock's performance has improved in recent times. Given the share price momentum remains strong, it might be worth taking a closer look at the stock, lest you miss an opportunity. It's always interesting to track share price performance over the longer term. But to understand ASM International better, we need to consider many other factors. Even so, be aware that ASM International is showing 1 warning sign in our investment analysis , you should know about...
There are plenty of other companies that have insiders buying up shares. You probably do not want to miss this free list of growing companies that insiders are buying.
Please note, the market returns quoted in this article reflect the market weighted average returns of stocks that currently trade on NL exchanges.
If you spot an error that warrants correction, please contact the editor at editorial-team@simplywallst.com. This article by Simply Wall St is general in nature. It does not constitute a recommendation to buy or sell any stock, and does not take account of your objectives, or your financial situation. Simply Wall St has no position in the stocks mentioned.
We aim to bring you long-term focused research analysis driven by fundamental data. Note that our analysis may not factor in the latest price-sensitive company announcements or qualitative material. Thank you for reading.
