
 Yahoo Finance
 Has ASOS Plc (LON:ASC) Been Employing Capital Shrewdly?

Today we are going to look at ASOS Plc (LON:ASC) to see whether it might be an attractive investment prospect. To be precise, we’ll consider its Return On Capital Employed (ROCE), as that will inform our view of the quality of the business.
First up, we’ll look at what ROCE is and how we calculate it. Then we’ll compare its ROCE to similar companies. And finally, we’ll look at how its current liabilities are impacting its ROCE.
Understanding Return On Capital Employed (ROCE)
ROCE is a measure of a company’s yearly pre-tax profit (its return), relative to the capital employed in the business. In general, businesses with a higher ROCE are usually better quality. Ultimately, it is a useful but imperfect metric. Author Edwin Whiting says to be careful when comparing the ROCE of different businesses, since ‘No two businesses are exactly alike.’
So, How Do We Calculate ROCE?
Analysts use this formula to calculate return on capital employed:
Return on Capital Employed = Earnings Before Interest and Tax (EBIT) ÷ (Total Assets – Current Liabilities)
Or for ASOS:
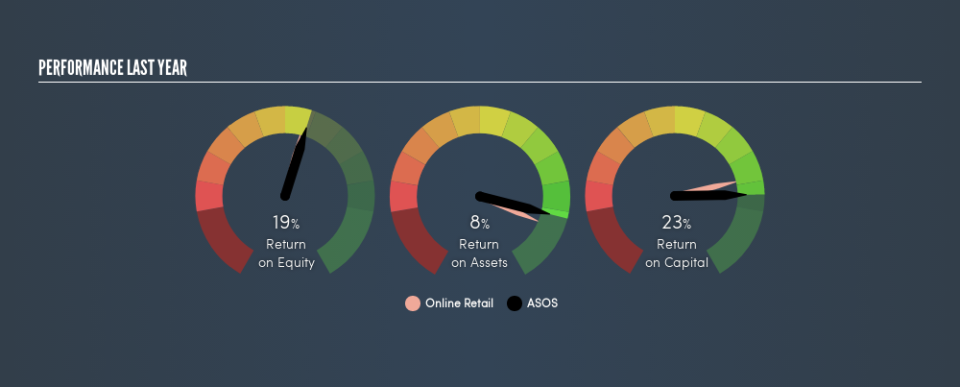
0.23 = UK£102m ÷ (UK£1.0b – UK£558m) (Based on the trailing twelve months to August 2018.)
Therefore, ASOS has an ROCE of 23%.
Check out our latest analysis for ASOS
Does ASOS Have A Good ROCE?
One way to assess ROCE is to compare similar companies. Using our data, ASOS’s ROCE appears to be around the 21% average of the Online Retail industry. Setting aside the comparison to its industry for a moment, ASOS’s ROCE in absolute terms currently looks quite high.
It is important to remember that ROCE shows past performance, and is not necessarily predictive. ROCE can be deceptive for cyclical businesses, as returns can look incredible in boom times, and terribly low in downturns. ROCE is only a point-in-time measure. Future performance is what matters, and you can see analyst predictions in our free report on analyst forecasts for the company.
ASOS’s Current Liabilities And Their Impact On Its ROCE
Current liabilities include invoices, such as supplier payments, short-term debt, or a tax bill, that need to be paid within 12 months. Due to the way the ROCE equation works, having large bills due in the near term can make it look as though a company has less capital employed, and thus a higher ROCE than usual. To counter this, investors can check if a company has high current liabilities relative to total assets.
ASOS has total assets of UK£1.0b and current liabilities of UK£558m. Therefore its current liabilities are equivalent to approximately 55% of its total assets. ASOS’s high level of current liabilities boost the ROCE – but its ROCE is still impressive.
The Bottom Line On ASOS’s ROCE
So we would be interested in doing more research here — there may be an opportunity! But note: ASOS may not be the best stock to buy. So take a peek at this free list of interesting companies with strong recent earnings growth (and a P/E ratio below 20).
If you are like me, then you will not want to miss this free list of growing companies that insiders are buying.
We aim to bring you long-term focused research analysis driven by fundamental data. Note that our analysis may not factor in the latest price-sensitive company announcements or qualitative material.
If you spot an error that warrants correction, please contact the editor at editorial-team@simplywallst.com. This article by Simply Wall St is general in nature. It does not constitute a recommendation to buy or sell any stock, and does not take account of your objectives, or your financial situation. Simply Wall St has no position in the stocks mentioned. Thank you for reading.
