
 Yahoo Finance
 Can ASR Nederland N.V.'s (AMS:ASRNL) ROE Continue To Surpass The Industry Average?
While some investors are already well versed in financial metrics (hat tip), this article is for those who would like to learn about Return On Equity (ROE) and why it is important. By way of learning-by-doing, we'll look at ROE to gain a better understanding of ASR Nederland N.V. (AMS:ASRNL).
Return on Equity or ROE is a test of how effectively a company is growing its value and managing investors’ money. In simpler terms, it measures the profitability of a company in relation to shareholder's equity.
See our latest analysis for ASR Nederland
How Is ROE Calculated?
ROE can be calculated by using the formula:
Return on Equity = Net Profit (from continuing operations) ÷ Shareholders' Equity
So, based on the above formula, the ROE for ASR Nederland is:
41% = €2.6b ÷ €6.3b (Based on the trailing twelve months to June 2023).
The 'return' is the amount earned after tax over the last twelve months. So, this means that for every €1 of its shareholder's investments, the company generates a profit of €0.41.
Does ASR Nederland Have A Good ROE?
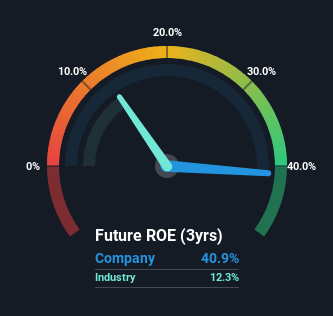
By comparing a company's ROE with its industry average, we can get a quick measure of how good it is. However, this method is only useful as a rough check, because companies do differ quite a bit within the same industry classification. As you can see in the graphic below, ASR Nederland has a higher ROE than the average (12%) in the Insurance industry.
That's clearly a positive. However, bear in mind that a high ROE doesn’t necessarily indicate efficient profit generation. A higher proportion of debt in a company's capital structure may also result in a high ROE, where the high debt levels could be a huge risk . Our risks dashboardshould have the 4 risks we have identified for ASR Nederland.
The Importance Of Debt To Return On Equity
Virtually all companies need money to invest in the business, to grow profits. That cash can come from retained earnings, issuing new shares (equity), or debt. In the first two cases, the ROE will capture this use of capital to grow. In the latter case, the use of debt will improve the returns, but will not change the equity. Thus the use of debt can improve ROE, albeit along with extra risk in the case of stormy weather, metaphorically speaking.
Combining ASR Nederland's Debt And Its 41% Return On Equity
ASR Nederland does use a high amount of debt to increase returns. It has a debt to equity ratio of 1.49. While no doubt that its ROE is impressive, we would have been even more impressed had the company achieved this with lower debt. Debt increases risk and reduces options for the company in the future, so you generally want to see some good returns from using it.
Conclusion
Return on equity is one way we can compare its business quality of different companies. A company that can achieve a high return on equity without debt could be considered a high quality business. All else being equal, a higher ROE is better.
Having said that, while ROE is a useful indicator of business quality, you'll have to look at a whole range of factors to determine the right price to buy a stock. Profit growth rates, versus the expectations reflected in the price of the stock, are a particularly important to consider. So you might want to take a peek at this data-rich interactive graph of forecasts for the company.
Of course, you might find a fantastic investment by looking elsewhere. So take a peek at this free list of interesting companies.
Have feedback on this article? Concerned about the content? Get in touch with us directly. Alternatively, email editorial-team (at) simplywallst.com.
This article by Simply Wall St is general in nature. We provide commentary based on historical data and analyst forecasts only using an unbiased methodology and our articles are not intended to be financial advice. It does not constitute a recommendation to buy or sell any stock, and does not take account of your objectives, or your financial situation. We aim to bring you long-term focused analysis driven by fundamental data. Note that our analysis may not factor in the latest price-sensitive company announcements or qualitative material. Simply Wall St has no position in any stocks mentioned.
