
 Yahoo Finance
 ASSA ABLOY (STO:ASSA B) Seems To Use Debt Quite Sensibly

David Iben put it well when he said, 'Volatility is not a risk we care about. What we care about is avoiding the permanent loss of capital.' So it might be obvious that you need to consider debt, when you think about how risky any given stock is, because too much debt can sink a company. As with many other companies ASSA ABLOY AB (publ) (STO:ASSA B) makes use of debt. But is this debt a concern to shareholders?
When Is Debt A Problem?
Generally speaking, debt only becomes a real problem when a company can't easily pay it off, either by raising capital or with its own cash flow. If things get really bad, the lenders can take control of the business. However, a more usual (but still expensive) situation is where a company must dilute shareholders at a cheap share price simply to get debt under control. Of course, debt can be an important tool in businesses, particularly capital heavy businesses. When we examine debt levels, we first consider both cash and debt levels, together.
View our latest analysis for ASSA ABLOY
What Is ASSA ABLOY's Net Debt?
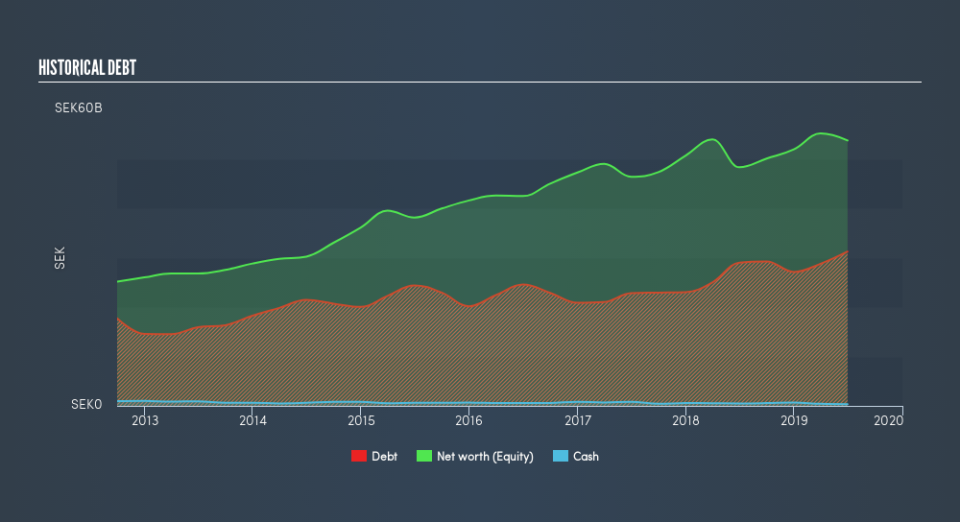
The image below, which you can click on for greater detail, shows that at June 2019 ASSA ABLOY had debt of kr31.2b, up from kr29.0b in one year. Net debt is about the same, since the it doesn't have much cash.
How Strong Is ASSA ABLOY's Balance Sheet?
According to the last reported balance sheet, ASSA ABLOY had liabilities of kr32.8b due within 12 months, and liabilities of kr30.5b due beyond 12 months. Offsetting these obligations, it had cash of kr355.0m as well as receivables valued at kr19.9b due within 12 months. So it has liabilities totalling kr43.0b more than its cash and near-term receivables, combined.
Of course, ASSA ABLOY has a titanic market capitalization of kr227.6b, so these liabilities are probably manageable. However, we do think it is worth keeping an eye on its balance sheet strength, as it may change over time.
We measure a company's debt load relative to its earnings power by looking at its net debt divided by its earnings before interest, tax, depreciation, and amortization (EBITDA) and by calculating how easily its earnings before interest and tax (EBIT) cover its interest expense (interest cover). The advantage of this approach is that we take into account both the absolute quantum of debt (with net debt to EBITDA) and the actual interest expenses associated with that debt (with its interest cover ratio).
We'd say that ASSA ABLOY's moderate net debt to EBITDA ratio ( being 2.0), indicates prudence when it comes to debt. And its strong interest cover of 14.2 times, makes us even more comfortable. ASSA ABLOY grew its EBIT by 7.8% in the last year. Whilst that hardly knocks our socks off it is a positive when it comes to debt. The balance sheet is clearly the area to focus on when you are analysing debt. But ultimately the future profitability of the business will decide if ASSA ABLOY can strengthen its balance sheet over time. So if you're focused on the future you can check out this free report showing analyst profit forecasts.
Finally, a company can only pay off debt with cold hard cash, not accounting profits. So it's worth checking how much of that EBIT is backed by free cash flow. During the last three years, ASSA ABLOY produced sturdy free cash flow equating to 68% of its EBIT, about what we'd expect. This free cash flow puts the company in a good position to pay down debt, when appropriate.
Our View
The good news is that ASSA ABLOY's demonstrated ability to cover its interest expense with its EBIT delights us like a fluffy puppy does a toddler. And that's just the beginning of the good news since its conversion of EBIT to free cash flow is also very heartening. Taking all this data into account, it seems to us that ASSA ABLOY takes a pretty sensible approach to debt. That means they are taking on a bit more risk, in the hope of boosting shareholder returns. Of course, we wouldn't say no to the extra confidence that we'd gain if we knew that ASSA ABLOY insiders have been buying shares: if you're on the same wavelength, you can find out if insiders are buying by clicking this link.
At the end of the day, it's often better to focus on companies that are free from net debt. You can access our special list of such companies (all with a track record of profit growth). It's free.
We aim to bring you long-term focused research analysis driven by fundamental data. Note that our analysis may not factor in the latest price-sensitive company announcements or qualitative material.
If you spot an error that warrants correction, please contact the editor at editorial-team@simplywallst.com. This article by Simply Wall St is general in nature. It does not constitute a recommendation to buy or sell any stock, and does not take account of your objectives, or your financial situation. Simply Wall St has no position in the stocks mentioned. Thank you for reading.
