
 Yahoo Finance
 Astronomers track over 25,000 supermassive black holes making most detailed map of its kind
Astronomers have published a map of the sky showing 25,000 black holes - the most detailed of its kind ever produced.
The map uses low radio frequencies, built from data from 52 stations across nine continents.
It covers an astounding four per cent of the northern half of the sky, but the scientists do not intend to stop until the entire sky has been mapped.
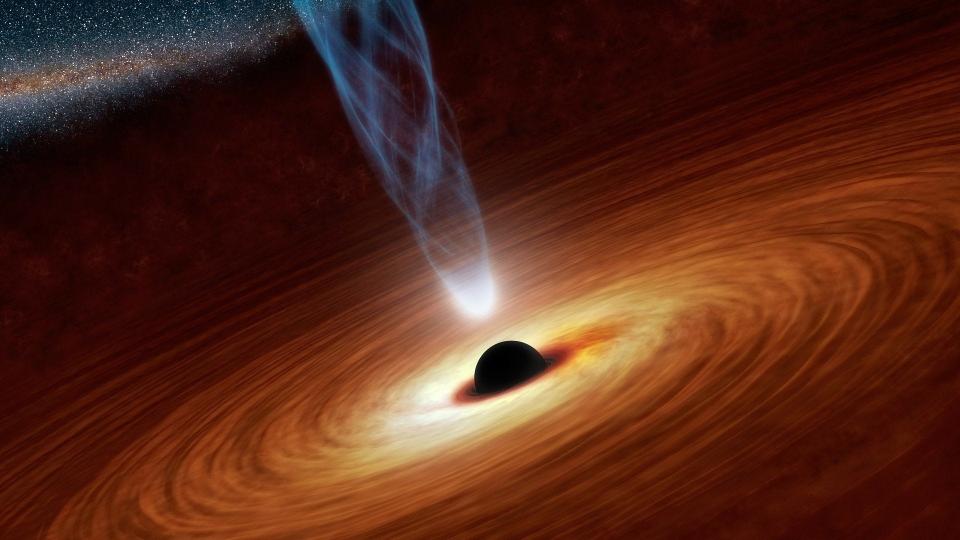
While the bright specs appear to be stars they are in fact supermassive black holes, with each one located in a distant galaxy.
“This is the result of many years of work on incredibly difficult data. We had to invent new methods to convert the radio signals into images of the sky”, research leader Francesco de Gasperin said in a statement.

Making the map was not easy; the ionosphere that surrounds the Earth - a layer of free electrons that clouds telescopes - makes it difficult to track the black holes.
“It’s similar to when you try to see the world while immersed in a swimming pool”, explains co-author Reinout van Weeren.
“When you look up, the waves on the water of the pool deflect the light rays and distort the view”,
In total, it took 256 hours of observations to make the map, and advanced equipment was needed to clear up the picture.
Supercomputers used by the researchers engaged algorithms to correct the effect of the ionosphere every four seconds.
“After many years of software development, it is so wonderful to see that this has now really worked out”, Huub Röttgering said.
The research has been accepted for publication in Astronomy & Astrophysics.
