AUD/USD Forex Technical Analysis – Closed on the Strong Side of Major Retracement Zone
The AUD/USD posted a wide range on Friday before closing higher. The Forex pair weakened after the U.S. reported solid consumer inflation data, but recovered enough to take out the October 13 top at .7897 before closing higher.
The Aussie continued to be helped by strong retail sales reported earlier in the week and the possibility of an earlier than expected rate hike by the Reserve Bank of Australia.
In addition to the Australian retail sales data, the recent rally has been driven by a combination of factors, including rising commodity prices, M&A flows, demand for bonds and rising risk appetite.
There was U.S. economic data released on Friday, but Aussie traders remained focused on Thursday’s release of a report that showed retail sales climbed 1.2 percent in November, trouncing expectations for a 0.4 percent increase. The report suggests that consumers may not be as downbeat as previously thought.
The technical chart pattern is strong, but the strong buying volume needs to continue. If the buying dries up, it will likely be related to investors unwilling to pay-up for the currency. This may be related to a drop in demand from China. If monetary conditions begin to tighten in the country, prices of copper, lead, zinc, silver and iron could start to sell-off, taking the Australian Dollar with them.

Daily Technical Swing Chart Analysis
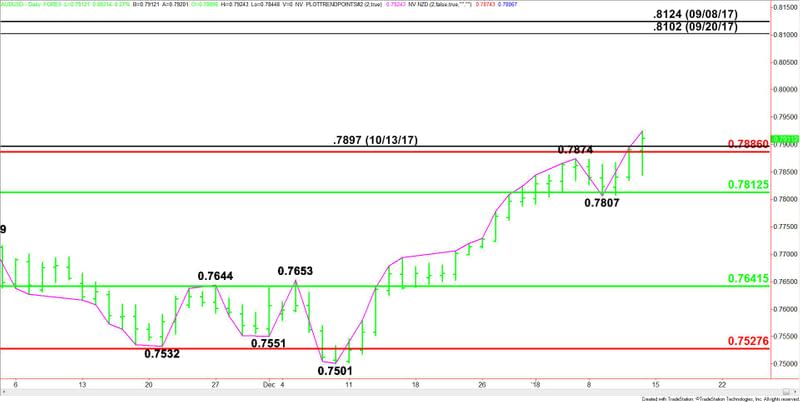
The main trend is up according to the daily swing chart. After a two-day setback last week, the uptrend resumed when buyers took out the swing top at .7874. It was reaffirmed when the October 13 top at .7897 was taken out.
A trade through .7807 will change the main trend to down.
The main range is .8124 to .7501. Its retracement zone is .7812 to .7886. Not only did the buying take out a pair of tops last week, but it also close on the strong side of the major retracement zone. This zone is new support.
If the buying continues, we could see an eventual move into the September 20 main top at .8102 and the September 8 main top at .8124.
The daily chart indicates that the buying has to continue to drive the AUD/USD away from the Fibonacci level at .7886 to sustain the rally.
A break back under .7886 will be the first sign of weakness. A move through .7812 the next and taking out .7807 will change the main trend to down.
This article was originally posted on FX Empire
More From FXEMPIRE:
FTSE 100 Price forecast for the week of January 15, 2018, Technical Analysis
DAX Price forecast for the week of January 15, 2018, Technical Analysis
AUD/USD and NZD/USD Fundamental Daily Forecast – NZ Showing Signs of Being Overheated
Crude Oil Price forecast for the week of January 15, 2018, Technical Analysis
Natural Gas Price forecast for the week of January 15, 2018, Technical Analysis

 Yahoo Finance