
 Yahoo Finance
 Avnet's (AVT) Earnings and Revenues Miss Estimates in Q3

Avnet AVT reported lower-than-expected third-quarter fiscal 2024 results. The company’s non-GAAP earnings were $1.10 per share, which came a penny lower than the Zacks Consensus Estimate of $1.11. Moreover, the reported figure came 45% lower than the year-ago quarter’s non-GAAP earnings of $2 per share, mainly due to lower revenues.
Revenues declined 13% year over year to $5.65 billion and came slightly lower than the Zacks Consensus Estimate of $5.70 billion. The company’s top-line performance reflects a negative impact of weakened demand amid uncertain economic conditions and inventory correction measures adopted by customers.
During the third quarter, Avnet witnessed mixed demand across the diverse end markets it serves. The company pointed out that demand declined across most of the end markets it operates in. However, the defense and data center end markets showed improvements.
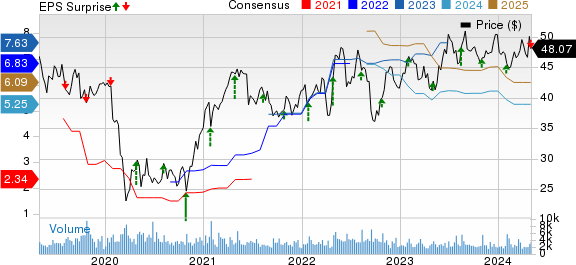
Avnet, Inc. Price, Consensus and EPS Surprise
Avnet, Inc. price-consensus-eps-surprise-chart | Avnet, Inc. Quote
Quarterly Details
The Electronic Components segment’s revenues were down 13.4% year over year to $5.25 billion as inventory levels for certain components still remain elevated, which is delaying inventory replenishment requirements. Our estimates for the Electronic Components segment’s revenues were pegged at $5.74 billion.
The Farnell segment’s revenues decreased 10.4% to $407.8 million. Our estimates for the Farnell segment’s revenues were pegged at $409.2 million.
Avnet reported a sales decline across all geographical regions. Revenues from America, Asia and the EMEA fell 18.2%, 8.7% and 14.2% year over year, respectively.
Avnet reported a gross profit of $669.3 million, down from the year-ago quarter’s gross profit of $811.8 million. The gross margin contracted 62 basis points (bps) year over year to 11.8%, primarily due to the lower gross margin at the Electronic Components and Farnell segments. Electronic Components’ gross margin was down year over year, primarily due to a lower mix of sales from the Western regions.
The adjusted operating income came in at $202.7 million, which decreased 35.6% year over year. The adjusted operating income for the Electronic Components segment declined 29% to $217 million, while that for Farnell’s plunged 60% to $16 million. Avnet’s adjusted operating margin shrank 124 bps to 3.6%. Electronic Components’ adjusted operating margin contracted 91 bps to 4.1%, while Farnell’s declined 499 bps to 4%.
Balance Sheet and Cash Flow
As of Mar 30, 2024, AVT had cash and cash equivalents of $218.5 million compared with $272.9 million reported at the end of the previous quarter.
The long-term debt was $2.41 billion as of Mar 30, down from $2.75 billion reported in the prior quarter. Avnet generated nearly $500 million of cash from operational activities during the third quarter of 2024. In the first nine months of fiscal 2024, it generated cash worth $415.7 million from operational activities.
The company did not repurchase any shares during the third quarter but paid $28 million in dividend payments to shareholders. In the first nine months of fiscal 2024, it repurchased shares worth $86 million and $84.1 million, respectively.
Fourth-Quarter Fiscal 2024 Guidance
Avnet estimates fourth-quarter fiscal 2024 revenues in the range of $5.20-$5.50 billion (midpoint $5.35 billion). Non-GAAP earnings for the current quarter are anticipated between 90 cents and $1.00 per share (midpoint 95 cents). The Zacks Consensus Estimate for fourth-quarter revenues and adjusted earnings is pegged at $5.71 billion and $1.12 per share, respectively.
Zacks Rank & Stocks to Consider
Avnet currently carries a Zacks Rank #3 (Hold). Shares of AVT have declined 3.4% over the past year.
Some better-ranked stocks in the broader technology sector are NVIDIA NVDA, Salesforce CRM and Twilio TWLO, each carrying a Zacks Rank #2 (Buy). You can see the complete list of today's Zacks #1 Rank (Strong Buy) stocks here.
The Zacks Consensus Estimate for NVIDIA’s fiscal 2025 earnings has been revised 10 cents upward to $23.94 per share in the past 30 days, which suggests year-over-year growth of 84.7%. The long-term estimated earnings growth rate for the stock stands at 30.9%. The NVDA stock has soared 67.6% YTD.
The Zacks Consensus Estimate for Salesforce’s fiscal 2025 earnings has been revised upward by 3 cents to $9.71 per share in the past 60 days, which calls for an increase of 18.1% on a year-over-year basis. The long-term expected earnings growth rate for the stock is pegged at 17.4%. CRM shares have increased 2.1% YTD.
The consensus mark for Twilio’s 2024 earnings has been revised upward by a penny to $2.71 per share over the past 30 days, which indicates a 10.6% increase from 2023. It has a long-term earnings growth expectation of 19.6%. The TWLO stock has declined 19.7% in the YTD period.
Want the latest recommendations from Zacks Investment Research? Today, you can download 7 Best Stocks for the Next 30 Days. Click to get this free report
Salesforce Inc. (CRM) : Free Stock Analysis Report
Avnet, Inc. (AVT) : Free Stock Analysis Report
NVIDIA Corporation (NVDA) : Free Stock Analysis Report
Twilio Inc. (TWLO) : Free Stock Analysis Report
