
 Yahoo Finance
 Update: AXA Equitable Holdings (NYSE:EQH) Stock Gained 49% In The Last Year

These days it's easy to simply buy an index fund, and your returns should (roughly) match the market. But one can do better than that by picking better than average stocks (as part of a diversified portfolio). To wit, the AXA Equitable Holdings, Inc. (NYSE:EQH) share price is 49% higher than it was a year ago, much better than the market return of around 28% (not including dividends) in the same period. If it can keep that out-performance up over the long term, investors will do very well! AXA Equitable Holdings hasn't been listed for long, so it's still not clear if it is a long term winner.
Check out our latest analysis for AXA Equitable Holdings
There is no denying that markets are sometimes efficient, but prices do not always reflect underlying business performance. By comparing earnings per share (EPS) and share price changes over time, we can get a feel for how investor attitudes to a company have morphed over time.
During the last year AXA Equitable Holdings grew its earnings per share (EPS) by 243%. This EPS growth is significantly higher than the 49% increase in the share price. Therefore, it seems the market isn't as excited about AXA Equitable Holdings as it was before. This could be an opportunity. This cautious sentiment is reflected in its (fairly low) P/E ratio of 11.05.
You can see below how EPS has changed over time (discover the exact values by clicking on the image).
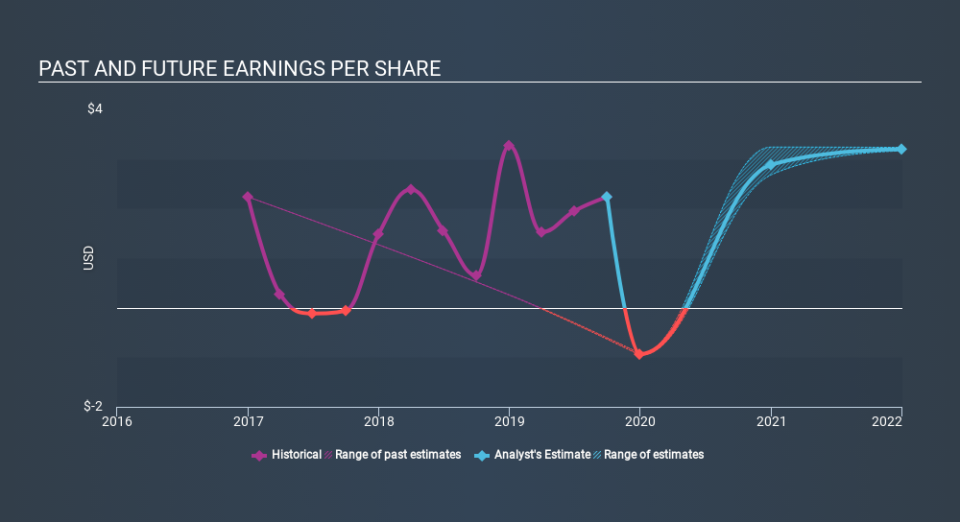
We like that insiders have been buying shares in the last twelve months. Having said that, most people consider earnings and revenue growth trends to be a more meaningful guide to the business. Before buying or selling a stock, we always recommend a close examination of historic growth trends, available here..
What About Dividends?
When looking at investment returns, it is important to consider the difference between total shareholder return (TSR) and share price return. The TSR incorporates the value of any spin-offs or discounted capital raisings, along with any dividends, based on the assumption that the dividends are reinvested. It's fair to say that the TSR gives a more complete picture for stocks that pay a dividend. We note that for AXA Equitable Holdings the TSR over the last year was 53%, which is better than the share price return mentioned above. And there's no prize for guessing that the dividend payments largely explain the divergence!
A Different Perspective
AXA Equitable Holdings boasts a total shareholder return of 53% for the last year (that includes the dividends) . And the share price momentum remains respectable, with a gain of 17% in the last three months. Demand for the stock from multiple parties is pushing the price higher; it could be that word is getting out about its virtues as a business. It is all well and good that insiders have been buying shares, but we suggest you check here to see what price insiders were buying at.
AXA Equitable Holdings is not the only stock insiders are buying. So take a peek at this free list of growing companies with insider buying.
Please note, the market returns quoted in this article reflect the market weighted average returns of stocks that currently trade on US exchanges.
If you spot an error that warrants correction, please contact the editor at editorial-team@simplywallst.com. This article by Simply Wall St is general in nature. It does not constitute a recommendation to buy or sell any stock, and does not take account of your objectives, or your financial situation. Simply Wall St has no position in the stocks mentioned.
We aim to bring you long-term focused research analysis driven by fundamental data. Note that our analysis may not factor in the latest price-sensitive company announcements or qualitative material. Thank you for reading.
