
 Yahoo Finance
 AXIS Capital Holdings (NYSE:AXS) investors are up 4.5% in the past week, but earnings have declined over the last five years
The main aim of stock picking is to find the market-beating stocks. But the main game is to find enough winners to more than offset the losers So we wouldn't blame long term AXIS Capital Holdings Limited (NYSE:AXS) shareholders for doubting their decision to hold, with the stock down 14% over a half decade.
While the stock has risen 4.5% in the past week but long term shareholders are still in the red, let's see what the fundamentals can tell us.
Check out our latest analysis for AXIS Capital Holdings
There is no denying that markets are sometimes efficient, but prices do not always reflect underlying business performance. One imperfect but simple way to consider how the market perception of a company has shifted is to compare the change in the earnings per share (EPS) with the share price movement.
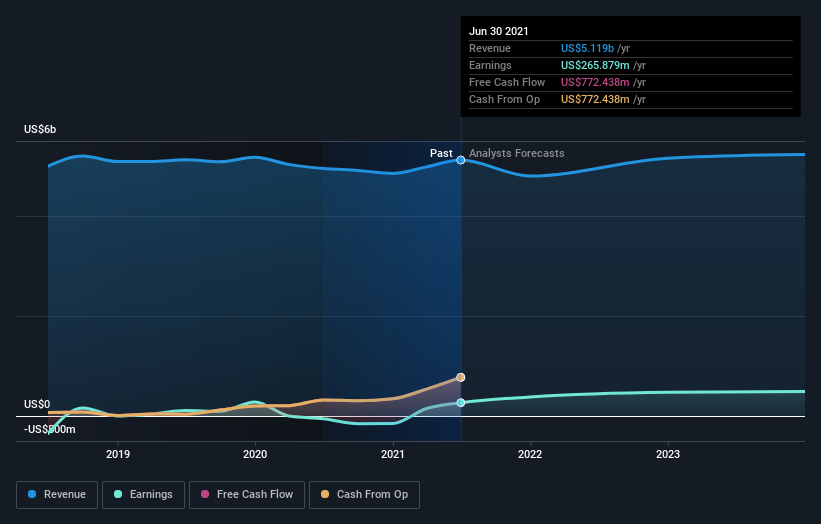
During five years of share price growth, AXIS Capital Holdings moved from a loss to profitability. That would generally be considered a positive, so we are surprised to see the share price is down. Other metrics may better explain the share price move.
Revenue is actually up 5.1% over the time period. A more detailed examination of the revenue and earnings may or may not explain why the share price languishes; there could be an opportunity.
You can see below how earnings and revenue have changed over time (discover the exact values by clicking on the image).
It is of course excellent to see how AXIS Capital Holdings has grown profits over the years, but the future is more important for shareholders. Take a more thorough look at AXIS Capital Holdings' financial health with this free report on its balance sheet.
What About Dividends?
It is important to consider the total shareholder return, as well as the share price return, for any given stock. The TSR is a return calculation that accounts for the value of cash dividends (assuming that any dividend received was reinvested) and the calculated value of any discounted capital raisings and spin-offs. So for companies that pay a generous dividend, the TSR is often a lot higher than the share price return. In the case of AXIS Capital Holdings, it has a TSR of 0.6% for the last 5 years. That exceeds its share price return that we previously mentioned. The dividends paid by the company have thusly boosted the total shareholder return.
A Different Perspective
AXIS Capital Holdings shareholders are up 14% for the year (even including dividends). But that return falls short of the market. On the bright side, that's still a gain, and it's actually better than the average return of 0.1% over half a decade This could indicate that the company is winning over new investors, as it pursues its strategy. Keeping this in mind, a solid next step might be to take a look at AXIS Capital Holdings' dividend track record. This free interactive graph is a great place to start.
Of course AXIS Capital Holdings may not be the best stock to buy. So you may wish to see this free collection of growth stocks.
Please note, the market returns quoted in this article reflect the market weighted average returns of stocks that currently trade on US exchanges.
This article by Simply Wall St is general in nature. We provide commentary based on historical data and analyst forecasts only using an unbiased methodology and our articles are not intended to be financial advice. It does not constitute a recommendation to buy or sell any stock, and does not take account of your objectives, or your financial situation. We aim to bring you long-term focused analysis driven by fundamental data. Note that our analysis may not factor in the latest price-sensitive company announcements or qualitative material. Simply Wall St has no position in any stocks mentioned.
Have feedback on this article? Concerned about the content? Get in touch with us directly. Alternatively, email editorial-team (at) simplywallst.com.
