
 Yahoo Finance
 Are B2Gold Corp.’s (TSE:BTO) High Returns Really That Great?

Today we'll evaluate B2Gold Corp. (TSE:BTO) to determine whether it could have potential as an investment idea. Specifically, we're going to calculate its Return On Capital Employed (ROCE), in the hopes of getting some insight into the business.
First of all, we'll work out how to calculate ROCE. Then we'll compare its ROCE to similar companies. And finally, we'll look at how its current liabilities are impacting its ROCE.
Understanding Return On Capital Employed (ROCE)
ROCE measures the 'return' (pre-tax profit) a company generates from capital employed in its business. Generally speaking a higher ROCE is better. Overall, it is a valuable metric that has its flaws. Author Edwin Whiting says to be careful when comparing the ROCE of different businesses, since 'No two businesses are exactly alike.
So, How Do We Calculate ROCE?
Analysts use this formula to calculate return on capital employed:
Return on Capital Employed = Earnings Before Interest and Tax (EBIT) ÷ (Total Assets - Current Liabilities)
Or for B2Gold:
0.084 = US$199m ÷ (US$2.6b - US$232m) (Based on the trailing twelve months to June 2019.)
So, B2Gold has an ROCE of 8.4%.
Check out our latest analysis for B2Gold
Is B2Gold's ROCE Good?
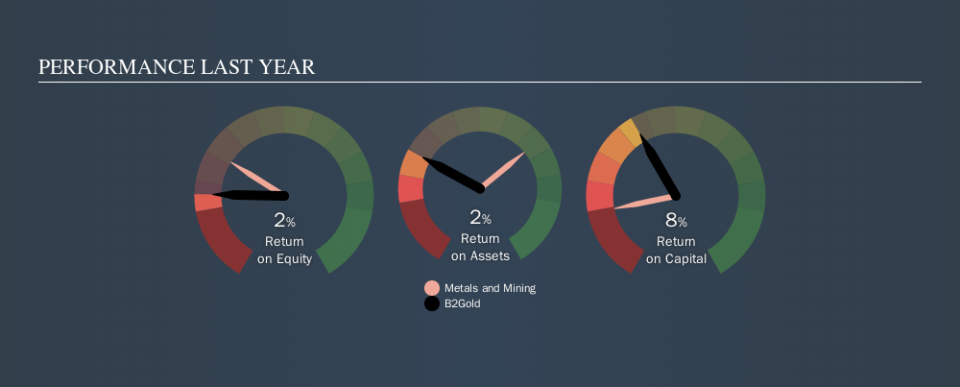
ROCE can be useful when making comparisons, such as between similar companies. In our analysis, B2Gold's ROCE is meaningfully higher than the 3.5% average in the Metals and Mining industry. We consider this a positive sign, because it suggests it uses capital more efficiently than similar companies. Setting aside the industry comparison for now, B2Gold's ROCE is mediocre in absolute terms, considering the risk of investing in stocks versus the safety of a bank account. It is possible that there are more rewarding investments out there.
B2Gold reported an ROCE of 8.4% -- better than 3 years ago, when the company didn't make a profit. That implies the business has been improving. You can see in the image below how B2Gold's ROCE compares to its industry. Click to see more on past growth.
When considering this metric, keep in mind that it is backwards looking, and not necessarily predictive. ROCE can be misleading for companies in cyclical industries, with returns looking impressive during the boom times, but very weak during the busts. ROCE is, after all, simply a snap shot of a single year. We note B2Gold could be considered a cyclical business. Since the future is so important for investors, you should check out our free report on analyst forecasts for B2Gold.
Do B2Gold's Current Liabilities Skew Its ROCE?
Liabilities, such as supplier bills and bank overdrafts, are referred to as current liabilities if they need to be paid within 12 months. Due to the way ROCE is calculated, a high level of current liabilities makes a company look as though it has less capital employed, and thus can (sometimes unfairly) boost the ROCE. To counteract this, we check if a company has high current liabilities, relative to its total assets.
B2Gold has total assets of US$2.6b and current liabilities of US$232m. Therefore its current liabilities are equivalent to approximately 9.0% of its total assets. B2Gold has a low level of current liabilities, which have a minimal impact on its uninspiring ROCE.
What We Can Learn From B2Gold's ROCE
B2Gold looks like an ok business, but on this analysis it is not at the top of our buy list. But note: make sure you look for a great company, not just the first idea you come across. So take a peek at this free list of interesting companies with strong recent earnings growth (and a P/E ratio below 20).
I will like B2Gold better if I see some big insider buys. While we wait, check out this free list of growing companies with considerable, recent, insider buying.
We aim to bring you long-term focused research analysis driven by fundamental data. Note that our analysis may not factor in the latest price-sensitive company announcements or qualitative material.
If you spot an error that warrants correction, please contact the editor at editorial-team@simplywallst.com. This article by Simply Wall St is general in nature. It does not constitute a recommendation to buy or sell any stock, and does not take account of your objectives, or your financial situation. Simply Wall St has no position in the stocks mentioned. Thank you for reading.
