
 Yahoo Finance
 Babcock International Group (LON:BAB) shareholders have endured a 62% loss from investing in the stock five years ago
We think intelligent long term investing is the way to go. But along the way some stocks are going to perform badly. For example the Babcock International Group PLC (LON:BAB) share price dropped 67% over five years. That's not a lot of fun for true believers.
Now let's have a look at the company's fundamentals, and see if the long term shareholder return has matched the performance of the underlying business.
View our latest analysis for Babcock International Group
Babcock International Group wasn't profitable in the last twelve months, it is unlikely we'll see a strong correlation between its share price and its earnings per share (EPS). Arguably revenue is our next best option. Shareholders of unprofitable companies usually expect strong revenue growth. That's because fast revenue growth can be easily extrapolated to forecast profits, often of considerable size.
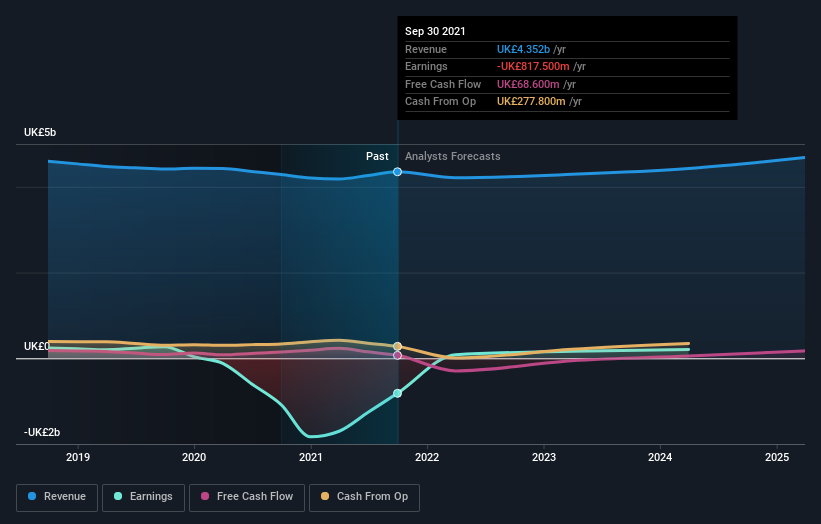
Over half a decade Babcock International Group reduced its trailing twelve month revenue by 1.5% for each year. While far from catastrophic that is not good. The share price decline of 11% compound, over five years, is understandable given the company is losing money, and revenue is moving in the wrong direction. The chance of imminent investor enthusiasm for this stock seems slimmer than Louise Brooks. Not that many investors like to invest in companies that are losing money and not growing revenue.
The graphic below depicts how earnings and revenue have changed over time (unveil the exact values by clicking on the image).
It's probably worth noting that the CEO is paid less than the median at similar sized companies. It's always worth keeping an eye on CEO pay, but a more important question is whether the company will grow earnings throughout the years. So we recommend checking out this free report showing consensus forecasts
What about the Total Shareholder Return (TSR)?
Investors should note that there's a difference between Babcock International Group's total shareholder return (TSR) and its share price change, which we've covered above. The TSR is a return calculation that accounts for the value of cash dividends (assuming that any dividend received was reinvested) and the calculated value of any discounted capital raisings and spin-offs. Babcock International Group's TSR of was a loss of 62% for the 5 years. That wasn't as bad as its share price return, because it has paid dividends.
A Different Perspective
It's good to see that Babcock International Group has rewarded shareholders with a total shareholder return of 6.4% in the last twelve months. Notably the five-year annualised TSR loss of 10% per year compares very unfavourably with the recent share price performance. The long term loss makes us cautious, but the short term TSR gain certainly hints at a brighter future. Before spending more time on Babcock International Group it might be wise to click here to see if insiders have been buying or selling shares.
Of course Babcock International Group may not be the best stock to buy. So you may wish to see this free collection of growth stocks.
Please note, the market returns quoted in this article reflect the market weighted average returns of stocks that currently trade on GB exchanges.
Have feedback on this article? Concerned about the content? Get in touch with us directly. Alternatively, email editorial-team (at) simplywallst.com.
This article by Simply Wall St is general in nature. We provide commentary based on historical data and analyst forecasts only using an unbiased methodology and our articles are not intended to be financial advice. It does not constitute a recommendation to buy or sell any stock, and does not take account of your objectives, or your financial situation. We aim to bring you long-term focused analysis driven by fundamental data. Note that our analysis may not factor in the latest price-sensitive company announcements or qualitative material. Simply Wall St has no position in any stocks mentioned.
