
 Yahoo Finance
 Banner (NASDAQ:BANR) shareholders have earned a 78% return over the last year
Passive investing in index funds can generate returns that roughly match the overall market. But if you pick the right individual stocks, you could make more than that. To wit, the Banner Corporation (NASDAQ:BANR) share price is 72% higher than it was a year ago, much better than the market return of around 35% (not including dividends) in the same period. If it can keep that out-performance up over the long term, investors will do very well! Zooming out, the stock is actually down 13% in the last three years.
With that in mind, it's worth seeing if the company's underlying fundamentals have been the driver of long term performance, or if there are some discrepancies.
Check out our latest analysis for Banner
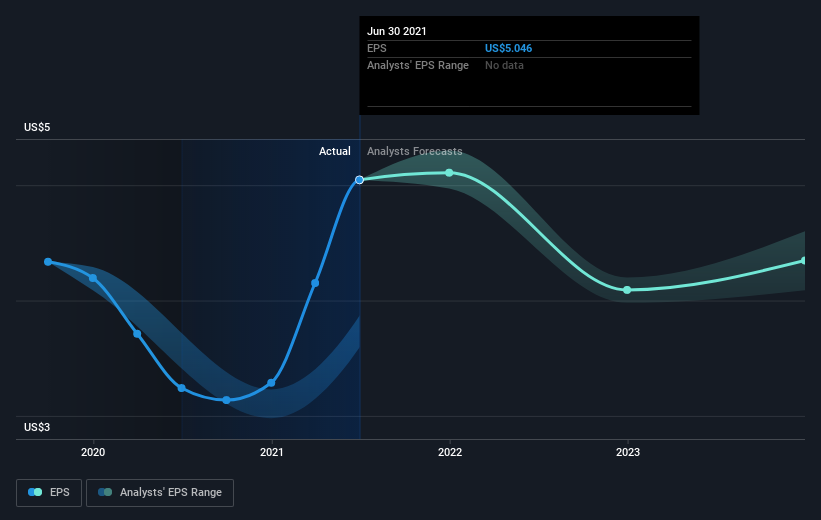
There is no denying that markets are sometimes efficient, but prices do not always reflect underlying business performance. One way to examine how market sentiment has changed over time is to look at the interaction between a company's share price and its earnings per share (EPS).
Banner was able to grow EPS by 56% in the last twelve months. This EPS growth is significantly lower than the 72% increase in the share price. So it's fair to assume the market has a higher opinion of the business than it a year ago.
The image below shows how EPS has tracked over time (if you click on the image you can see greater detail).
We know that Banner has improved its bottom line over the last three years, but what does the future have in store? If you are thinking of buying or selling Banner stock, you should check out this FREE detailed report on its balance sheet.
What About Dividends?
It is important to consider the total shareholder return, as well as the share price return, for any given stock. Whereas the share price return only reflects the change in the share price, the TSR includes the value of dividends (assuming they were reinvested) and the benefit of any discounted capital raising or spin-off. It's fair to say that the TSR gives a more complete picture for stocks that pay a dividend. In the case of Banner, it has a TSR of 78% for the last 1 year. That exceeds its share price return that we previously mentioned. This is largely a result of its dividend payments!
A Different Perspective
It's nice to see that Banner shareholders have received a total shareholder return of 78% over the last year. That's including the dividend. That's better than the annualised return of 8% over half a decade, implying that the company is doing better recently. Given the share price momentum remains strong, it might be worth taking a closer look at the stock, lest you miss an opportunity. I find it very interesting to look at share price over the long term as a proxy for business performance. But to truly gain insight, we need to consider other information, too. Consider for instance, the ever-present spectre of investment risk. We've identified 2 warning signs with Banner (at least 1 which can't be ignored) , and understanding them should be part of your investment process.
Of course, you might find a fantastic investment by looking elsewhere. So take a peek at this free list of companies we expect will grow earnings.
Please note, the market returns quoted in this article reflect the market weighted average returns of stocks that currently trade on US exchanges.
This article by Simply Wall St is general in nature. We provide commentary based on historical data and analyst forecasts only using an unbiased methodology and our articles are not intended to be financial advice. It does not constitute a recommendation to buy or sell any stock, and does not take account of your objectives, or your financial situation. We aim to bring you long-term focused analysis driven by fundamental data. Note that our analysis may not factor in the latest price-sensitive company announcements or qualitative material. Simply Wall St has no position in any stocks mentioned.
Have feedback on this article? Concerned about the content? Get in touch with us directly. Alternatively, email editorial-team (at) simplywallst.com.
