
 Yahoo Finance
 Barratt Developments PLC’s (LON:BDEV) Earnings Grew 16%, Did It Beat Long-Term Trend?

For investors with a long-term horizon, assessing earnings trend over time and against industry benchmarks is more valuable than looking at a single earnings announcement in one point in time. Investors may find my commentary, albeit very high-level and brief, on Barratt Developments PLC (LON:BDEV) useful as an attempt to give more color around how Barratt Developments is currently performing.
View our latest analysis for Barratt Developments
Were BDEV’s earnings stronger than its past performances and the industry?
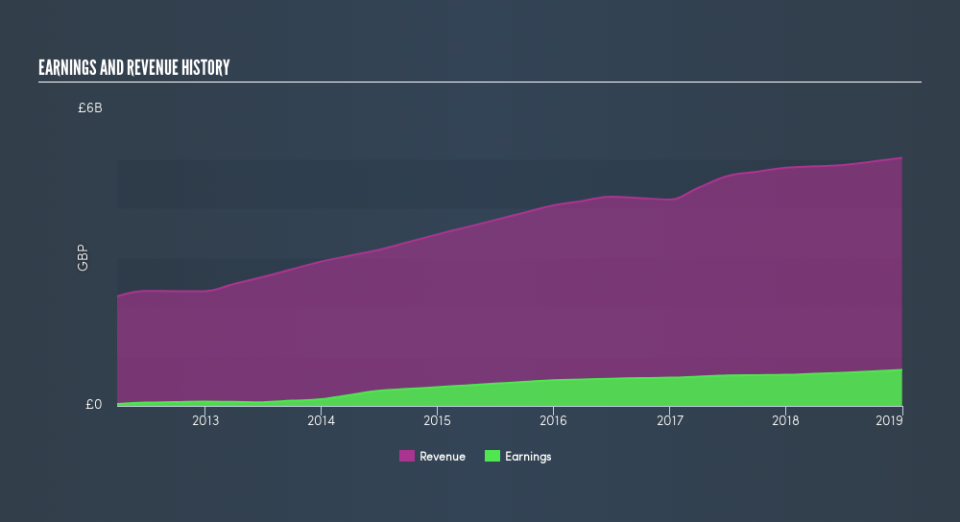
BDEV’s trailing twelve-month earnings (from 31 December 2018) of UK£729m has jumped 16% compared to the previous year.
However, this one-year growth rate has been lower than its average earnings growth rate over the past 5 years of 19%, indicating the rate at which BDEV is growing has slowed down. To understand what’s happening, let’s take a look at what’s occurring with margins and if the entire industry is feeling the heat.
In terms of returns from investment, Barratt Developments has fallen short of achieving a 20% return on equity (ROE), recording 16% instead. However, its return on assets (ROA) of 11% exceeds the GB Consumer Durables industry of 11%, indicating Barratt Developments has used its assets more efficiently. And finally, its return on capital (ROC), which also accounts for Barratt Developments’s debt level, has increased over the past 3 years from 14% to 18%. This correlates with a decrease in debt holding, with debt-to-equity ratio declining from 11% to 4.4% over the past 5 years.
What does this mean?
While past data is useful, it doesn’t tell the whole story. While Barratt Developments has a good historical track record with positive growth and profitability, there’s no certainty that this will extrapolate into the future. I recommend you continue to research Barratt Developments to get a more holistic view of the stock by looking at:
Future Outlook: What are well-informed industry analysts predicting for BDEV’s future growth? Take a look at our free research report of analyst consensus for BDEV’s outlook.
Financial Health: Are BDEV’s operations financially sustainable? Balance sheets can be hard to analyze, which is why we’ve done it for you. Check out our financial health checks here.
Other High-Performing Stocks: Are there other stocks that provide better prospects with proven track records? Explore our free list of these great stocks here.
NB: Figures in this article are calculated using data from the trailing twelve months from 31 December 2018. This may not be consistent with full year annual report figures.
We aim to bring you long-term focused research analysis driven by fundamental data. Note that our analysis may not factor in the latest price-sensitive company announcements or qualitative material.
If you spot an error that warrants correction, please contact the editor at editorial-team@simplywallst.com. This article by Simply Wall St is general in nature. It does not constitute a recommendation to buy or sell any stock, and does not take account of your objectives, or your financial situation. Simply Wall St has no position in the stocks mentioned. Thank you for reading.
