
 Yahoo Finance
 BBGI Global Infrastructure (LON:BBGI) shareholders have earned a 10% CAGR over the last five years
Stock pickers are generally looking for stocks that will outperform the broader market. And the truth is, you can make significant gains if you buy good quality businesses at the right price. For example, long term BBGI Global Infrastructure S.A. (LON:BBGI) shareholders have enjoyed a 31% share price rise over the last half decade, well in excess of the market return of around 11% (not including dividends). However, more recent returns haven't been as impressive as that, with the stock returning just 7.0% in the last year , including dividends .
So let's investigate and see if the longer term performance of the company has been in line with the underlying business' progress.
See our latest analysis for BBGI Global Infrastructure
There is no denying that markets are sometimes efficient, but prices do not always reflect underlying business performance. One flawed but reasonable way to assess how sentiment around a company has changed is to compare the earnings per share (EPS) with the share price.
BBGI Global Infrastructure's earnings per share are down 15% per year, despite strong share price performance over five years.
Essentially, it doesn't seem likely that investors are focused on EPS. Since the change in EPS doesn't seem to correlate with the change in share price, it's worth taking a look at other metrics.
We note that the dividend is higher than it was previously - always nice to see. Maybe dividend investors have helped support the share price.
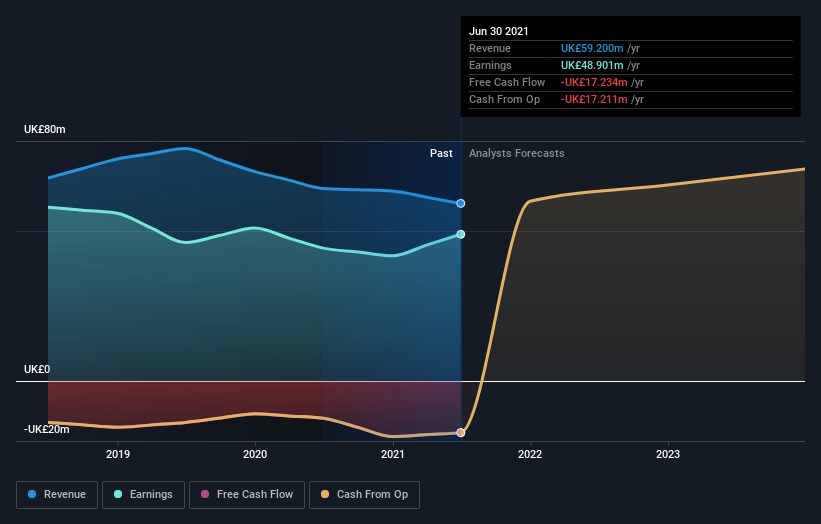
You can see how earnings and revenue have changed over time in the image below (click on the chart to see the exact values).
This free interactive report on BBGI Global Infrastructure's balance sheet strength is a great place to start, if you want to investigate the stock further.
What About Dividends?
As well as measuring the share price return, investors should also consider the total shareholder return (TSR). Whereas the share price return only reflects the change in the share price, the TSR includes the value of dividends (assuming they were reinvested) and the benefit of any discounted capital raising or spin-off. It's fair to say that the TSR gives a more complete picture for stocks that pay a dividend. As it happens, BBGI Global Infrastructure's TSR for the last 5 years was 63%, which exceeds the share price return mentioned earlier. The dividends paid by the company have thusly boosted the total shareholder return.
A Different Perspective
BBGI Global Infrastructure shareholders are up 7.0% for the year (even including dividends). But that return falls short of the market. On the bright side, the longer term returns (running at about 10% a year, over half a decade) look better. Maybe the share price is just taking a breather while the business executes on its growth strategy. It's always interesting to track share price performance over the longer term. But to understand BBGI Global Infrastructure better, we need to consider many other factors. Case in point: We've spotted 3 warning signs for BBGI Global Infrastructure you should be aware of, and 1 of them is a bit unpleasant.
But note: BBGI Global Infrastructure may not be the best stock to buy. So take a peek at this free list of interesting companies with past earnings growth (and further growth forecast).
Please note, the market returns quoted in this article reflect the market weighted average returns of stocks that currently trade on GB exchanges.
Have feedback on this article? Concerned about the content? Get in touch with us directly. Alternatively, email editorial-team (at) simplywallst.com.
This article by Simply Wall St is general in nature. We provide commentary based on historical data and analyst forecasts only using an unbiased methodology and our articles are not intended to be financial advice. It does not constitute a recommendation to buy or sell any stock, and does not take account of your objectives, or your financial situation. We aim to bring you long-term focused analysis driven by fundamental data. Note that our analysis may not factor in the latest price-sensitive company announcements or qualitative material. Simply Wall St has no position in any stocks mentioned.
