
 Yahoo Finance
 Can you beat the market with Investment Trusts?
A recent MoneyWeek survey found that Investment Trusts are the second most popular investment in the UK after regular stocks and shares. Trusts are even more popular than mutual funds with UK private investors. Many readers will therefore be pleased to learn that we plan to provide more in depth analysis of UK Investment Trusts at Stockopedia.com as we go forward.
A key feature of our coverage will be a ranking system which seeks to identify Investment Trusts that have a higher probability chance of beating the market (ie. a TrustRank). We’ve already started to research the datapoints to include in a TrustRank. We thought we’d share our initial findings with you and throw it open to debate.
What is an Investment Trust?
Before getting into the nitty gritty, let’s take a moment to understand what Investment Trusts are. Investment Trusts (also known as closed-end trusts) are publicly traded companies, but while companies like Apple make money by selling phones, and firms like HP sell printers, Investment Trusts make money by investing in other companies.
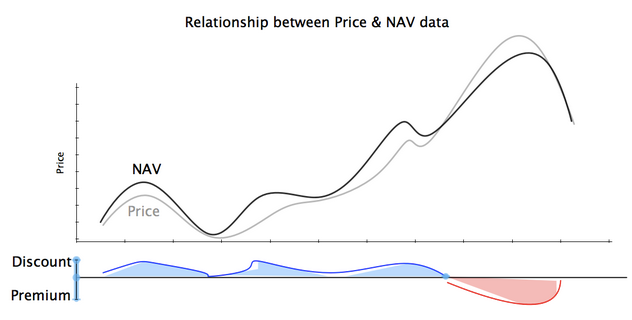
Trusts build portfolios of stocks, bonds and other investments (eg. property). In a nutshell, if you take account of liabilities, and divide the value of a Trust’s portfolios by the number of shares the Trust has issued, you get the Net Asset Value, or NAV (see below).
NAV = Trust’s Assets - Liabilities / Number of Shares the Trust has issued
However, because Trusts are publicly traded companies, their share price is determined by investor sentiment and the forces of market supply and demand. This means that share prices can become lower (or higher) than the NAV, creating opportunities for investors to buy Trusts at a discount (or premium) to the NAV (ie. the assets and investments which Trusts own). Is the mismatch between the NAV and the share price a dream come true for value investors…?
Cheap beats expensive
Benjamin Graham, the father of value investing and tutor of Warren Buffett, was amongst the first to notice that the value effect can work for Investment Trusts. He advised that 'if you want to put your money in investment funds, buy a group of closed-end shares at a discount of, say, 10% to 15% from asset value.' Why? Trusts trading at a discount tend to beat Trusts trading at a premium, at least over the longer run.
Graham made this observation in The Intelligent Investor, which was first published in 1949, but academic research since then has further corroborated Graham's findings.
Blending Value with Quality
Investment Trusts may trade at a discount, but what if there is something wrong with them...? Indeed, investors should be wary of value traps - Investment Trusts which are cheap because they are low quality junk companies. But how can we measure the quality of an Investment Trust?
NAV Returns
Jim Slater pays close attention to the long-term NAV returns (ie. the change in the NAV's value over a given period). If the NAV goes up, it is often the case that an Investment Trust’s portfolio has appreciated in value. A high quality Investment Trust may generate higher NAV returns. Accordingly, Slater advises that 'the factors to consider when choosing an Investment Trust are the long-term performance record [inc. the NAV returns], the level of gearing, and the discount to NAV.' We'll come back to gearing later. But first let's explore why Trusts with higher NAV returns might also generate higher share price returns.
The answer is quite straight forward. Perhaps unsurprisingly, investors are usually prepared to pay higher prices for Trusts with stronger NAV returns. Investment Trusts magazine used to invite financial analysts to make recommendations of their preferred Trusts, with a paragraph of justification. Over the period 1997-2000, there were 83 recommendations of conventional Investment Trusts. According to Bleaney, past performance or the quality of management was cited as a reason for buying the Trusts in 51 cases.
This is of course anecdotal evidence, but the numbers tell a similar story. In The Intelligent Investor, Graham showed that Trusts selling at premiums had often generated stronger long-term NAV returns (see below).
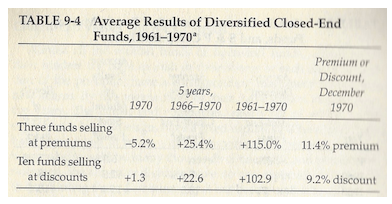
Admittedly, Graham only used a sample of thirteen Trusts. But more recent studies which examine larger samples also suggest that Trusts with stronger NAV returns are more expensive. For example, Dimson and Minio-Kozerski analysed nearly 400 UK Trusts and observed that when 'funds are ranked on past managerial performance, measured over one, two and three years, and allocated to deciles, the worst performing portfolios tend to be characterised by wider discounts.'
Volatility of NAV Returns
A checklist that only uses two datapoints (the discount and NAV returns) might not sound watertight. Can investors use other criteria? Some investors judge the quality of a company by looking at the volatility of earnings and sales growth. Poor quality companies may enjoy rapid sales growth one year, before sales jump off a cliff the next. Conversely, high quality companies may generate more stable, less volatile sales each year.
Similarly, higher quality Trusts may generate more consistent, less volatile NAV returns. Academic research suggests that investors pay higher prices if NAV returns are less volatile. For example, Dimson and Minio-Kozerski defined the ‘residual risk’ as the volatility of NAV returns and observed ‘the higher the residual risk, the higher is the absolute value of the discount.’
Other factors to consider
If Trusts with higher, more stable NAV returns are usually more expensive, it follows that an undervalued Trust could perhaps be one that trades at a discount, but has also generated stronger, more stable NAV returns over time. However, the economist John Maynard Keynes warned investors that ‘markets can remain irrational a lot longer than you and I can remain solvent.’
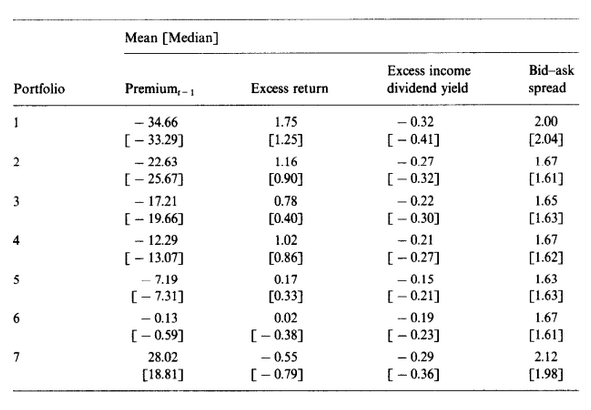
What does this mean? A Trust may be undervalued, but investors won’t make any money until the rest of market recognises and exploits the investment opportunity, driving the price up. So any investment strategy should take account of the factors which might prevent investors from buying undervalued Trusts. Such factors could include the dividend and the bid-ask spread.
In a nutshell, the academic literature suggests that discounted Trusts beat Trusts which trade at a premium. Furthermore, Trusts trade with a narrower discount when: the NAV returns and dividend yields are higher; and the bid-ask spread and volatility of NAV returns are lower. Putting it all together, finding trusts that are both at a discount but have stable NAV returns and tighter spreads ought to lead to further outperformance.
Of course, at Stockopedia we’ve become best known for our equity indicators. The high StockRank stocks have outperformed the market, the low StockRank stocks have underperformed. If past trends persist, then by analysing the top Investment Trust equity holdings we may be able to find those Trusts whose holdings position them best for equity led outperformance.
So to sum up some of the factors we are considering entering into our Investment ‘TrustRank’ include the following:
We’d be interested to learn about your reaction to these ideas, or even if you have a few of your own. These metrics are under development so please add your comments below...
Read More about value investing on Stockopedia
See the latest Stockmarket News, Commentary & Analysis on Stockopedia
