
 Yahoo Finance
 What is Behind Elmos Semiconductor AG’s (ETR:ELG) Superior ROE?

I am writing today to help inform people who are new to the stock market and want to begin learning the link between company’s fundamentals and stock market performance.
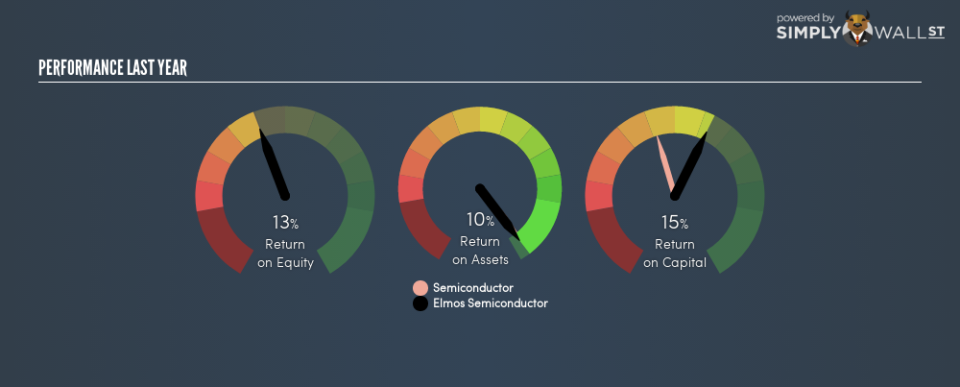
With an ROE of 12.68%, Elmos Semiconductor AG (ETR:ELG) outpaced its own industry which delivered a less exciting 12.60% over the past year. On the surface, this looks fantastic since we know that ELG has made large profits from little equity capital; however, ROE doesn’t tell us if management have borrowed heavily to make this happen. We’ll take a closer look today at factors like financial leverage to determine whether ELG’s ROE is actually sustainable.
See our latest analysis for Elmos Semiconductor
Breaking down ROE — the mother of all ratios
Return on Equity (ROE) weighs Elmos Semiconductor’s profit against the level of its shareholders’ equity. It essentially shows how much the company can generate in earnings given the amount of equity it has raised. While a higher ROE is preferred in most cases, there are several other factors we should consider before drawing any conclusions.
Return on Equity = Net Profit ÷ Shareholders Equity
Returns are usually compared to costs to measure the efficiency of capital. Elmos Semiconductor’s cost of equity is 10.83%. This means Elmos Semiconductor returns enough to cover its own cost of equity, with a buffer of 1.85%. This sustainable practice implies that the company pays less for its capital than what it generates in return. ROE can be split up into three useful ratios: net profit margin, asset turnover, and financial leverage. This is called the Dupont Formula:
Dupont Formula
ROE = profit margin × asset turnover × financial leverage
ROE = (annual net profit ÷ sales) × (sales ÷ assets) × (assets ÷ shareholders’ equity)
ROE = annual net profit ÷ shareholders’ equity
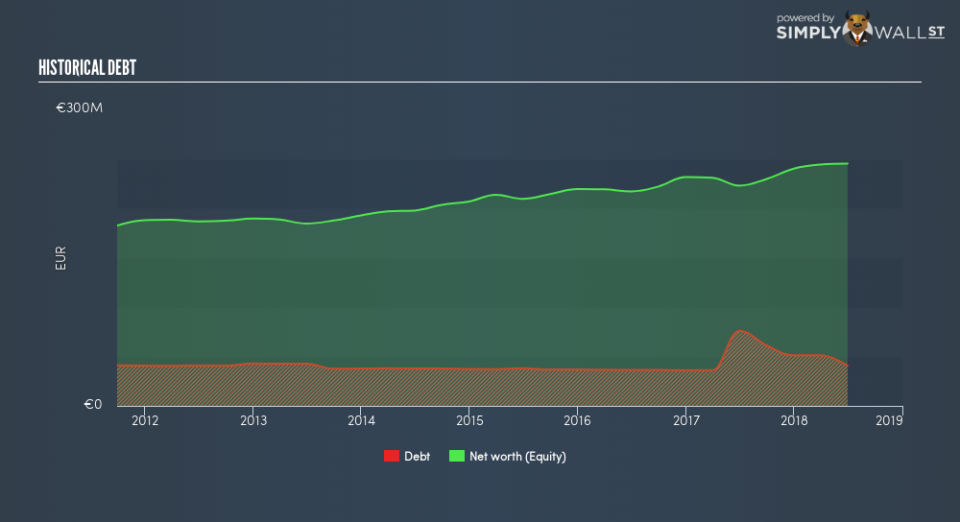
Basically, profit margin measures how much of revenue trickles down into earnings which illustrates how efficient the business is with its cost management. Asset turnover shows how much revenue Elmos Semiconductor can generate with its current asset base. The most interesting ratio, and reflective of sustainability of its ROE, is financial leverage. Since financial leverage can artificially inflate ROE, we need to look at how much debt Elmos Semiconductor currently has. At 16.58%, Elmos Semiconductor’s debt-to-equity ratio appears low and indicates the above-average ROE is generated from its capacity to increase profit without a large debt burden.
Next Steps:
ROE is a simple yet informative ratio, illustrating the various components that each measure the quality of the overall stock. Elmos Semiconductor exhibits a strong ROE against its peers, as well as sufficient returns to cover its cost of equity. ROE is not likely to be inflated by excessive debt funding, giving shareholders more conviction in the sustainability of high returns. ROE is a helpful signal, but it is definitely not sufficient on its own to make an investment decision.
For Elmos Semiconductor, I’ve put together three key factors you should further research:
Financial Health: Does it have a healthy balance sheet? Take a look at our free balance sheet analysis with six simple checks on key factors like leverage and risk.
Valuation: What is Elmos Semiconductor worth today? Is the stock undervalued, even when its growth outlook is factored into its intrinsic value? The intrinsic value infographic in our free research report helps visualize whether Elmos Semiconductor is currently mispriced by the market.
Other High-Growth Alternatives : Are there other high-growth stocks you could be holding instead of Elmos Semiconductor? Explore our interactive list of stocks with large growth potential to get an idea of what else is out there you may be missing!
To help readers see past the short term volatility of the financial market, we aim to bring you a long-term focused research analysis purely driven by fundamental data. Note that our analysis does not factor in the latest price-sensitive company announcements.
The author is an independent contributor and at the time of publication had no position in the stocks mentioned. For errors that warrant correction please contact the editor at editorial-team@simplywallst.com.