
 Yahoo Finance
 Is Belvoir Group PLC's (LON:BLV) Stock's Recent Performance Being Led By Its Attractive Financial Prospects?
Most readers would already be aware that Belvoir Group's (LON:BLV) stock increased significantly by 21% over the past three months. Given that the market rewards strong financials in the long-term, we wonder if that is the case in this instance. Particularly, we will be paying attention to Belvoir Group's ROE today.
Return on equity or ROE is a key measure used to assess how efficiently a company's management is utilizing the company's capital. In short, ROE shows the profit each dollar generates with respect to its shareholder investments.
View our latest analysis for Belvoir Group
How To Calculate Return On Equity?
The formula for return on equity is:
Return on Equity = Net Profit (from continuing operations) ÷ Shareholders' Equity
So, based on the above formula, the ROE for Belvoir Group is:
19% = UK£5.3m ÷ UK£28m (Based on the trailing twelve months to December 2020).
The 'return' is the amount earned after tax over the last twelve months. That means that for every £1 worth of shareholders' equity, the company generated £0.19 in profit.
What Is The Relationship Between ROE And Earnings Growth?
Thus far, we have learned that ROE measures how efficiently a company is generating its profits. We now need to evaluate how much profit the company reinvests or "retains" for future growth which then gives us an idea about the growth potential of the company. Generally speaking, other things being equal, firms with a high return on equity and profit retention, have a higher growth rate than firms that don’t share these attributes.
A Side By Side comparison of Belvoir Group's Earnings Growth And 19% ROE
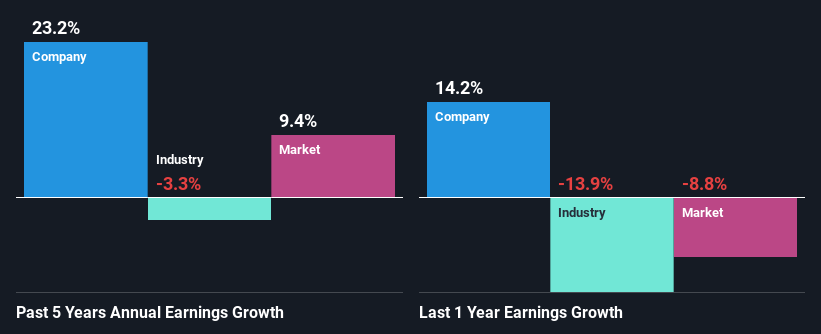
To begin with, Belvoir Group seems to have a respectable ROE. Further, the company's ROE compares quite favorably to the industry average of 6.6%. This probably laid the ground for Belvoir Group's significant 23% net income growth seen over the past five years. We believe that there might also be other aspects that are positively influencing the company's earnings growth. For instance, the company has a low payout ratio or is being managed efficiently.
Given that the industry shrunk its earnings at a rate of 3.3% in the same period, the net income growth of the company is quite impressive.
Earnings growth is a huge factor in stock valuation. The investor should try to establish if the expected growth or decline in earnings, whichever the case may be, is priced in. Doing so will help them establish if the stock's future looks promising or ominous. One good indicator of expected earnings growth is the P/E ratio which determines the price the market is willing to pay for a stock based on its earnings prospects. So, you may want to check if Belvoir Group is trading on a high P/E or a low P/E, relative to its industry.
Is Belvoir Group Making Efficient Use Of Its Profits?
Belvoir Group has a significant three-year median payout ratio of 56%, meaning the company only retains 44% of its income. This implies that the company has been able to achieve high earnings growth despite returning most of its profits to shareholders.
Besides, Belvoir Group has been paying dividends over a period of nine years. This shows that the company is committed to sharing profits with its shareholders. Upon studying the latest analysts' consensus data, we found that the company's future payout ratio is expected to drop to 42% over the next three years. However, the company's ROE is not expected to change by much despite the lower expected payout ratio.
Conclusion
On the whole, we feel that Belvoir Group's performance has been quite good. We are particularly impressed by the considerable earnings growth posted by the company, which was likely backed by its high ROE. While the company is paying out most of its earnings as dividends, it has been able to grow its earnings in spite of it, so that's probably a good sign. That being so, a study of the latest analyst forecasts show that the company is expected to see a slowdown in its future earnings growth. To know more about the latest analysts predictions for the company, check out this visualization of analyst forecasts for the company.
This article by Simply Wall St is general in nature. It does not constitute a recommendation to buy or sell any stock, and does not take account of your objectives, or your financial situation. We aim to bring you long-term focused analysis driven by fundamental data. Note that our analysis may not factor in the latest price-sensitive company announcements or qualitative material. Simply Wall St has no position in any stocks mentioned.
Have feedback on this article? Concerned about the content? Get in touch with us directly. Alternatively, email editorial-team (at) simplywallst.com.
