
 Yahoo Finance
 Benign Growth For Alector, Inc. (NASDAQ:ALEC) Underpins Its Share Price
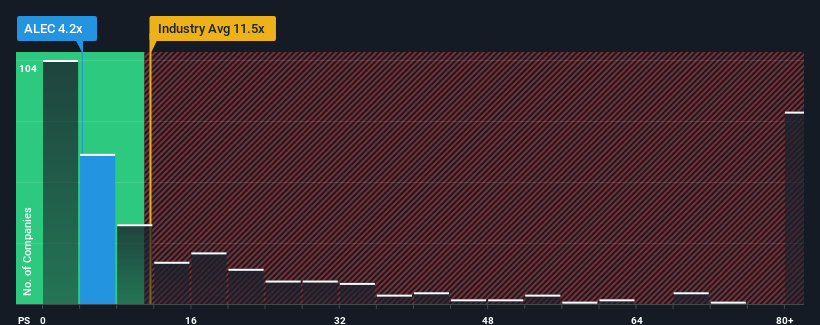
With a price-to-sales (or "P/S") ratio of 4.2x Alector, Inc. (NASDAQ:ALEC) may be sending very bullish signals at the moment, given that almost half of all the Biotechs companies in the United States have P/S ratios greater than 11.5x and even P/S higher than 53x are not unusual. Nonetheless, we'd need to dig a little deeper to determine if there is a rational basis for the highly reduced P/S.
Check out our latest analysis for Alector
How Alector Has Been Performing
While the industry has experienced revenue growth lately, Alector's revenue has gone into reverse gear, which is not great. The P/S ratio is probably low because investors think this poor revenue performance isn't going to get any better. If you still like the company, you'd be hoping this isn't the case so that you could potentially pick up some stock while it's out of favour.
Want the full picture on analyst estimates for the company? Then our free report on Alector will help you uncover what's on the horizon.
Is There Any Revenue Growth Forecasted For Alector?
Alector's P/S ratio would be typical for a company that's expected to deliver very poor growth or even falling revenue, and importantly, perform much worse than the industry.
Retrospectively, the last year delivered a frustrating 35% decrease to the company's top line. Spectacularly, three year revenue growth has ballooned by several orders of magnitude, despite the drawbacks experienced in the last 12 months. So while the company has done a great job in the past, it's somewhat concerning to see revenue growth decline so harshly.
Shifting to the future, estimates from the ten analysts covering the company suggest revenue growth is heading into negative territory, declining 25% per annum over the next three years. With the industry predicted to deliver 104% growth per annum, that's a disappointing outcome.
With this in consideration, we find it intriguing that Alector's P/S is closely matching its industry peers. However, shrinking revenues are unlikely to lead to a stable P/S over the longer term. Even just maintaining these prices could be difficult to achieve as the weak outlook is weighing down the shares.
The Final Word
While the price-to-sales ratio shouldn't be the defining factor in whether you buy a stock or not, it's quite a capable barometer of revenue expectations.
With revenue forecasts that are inferior to the rest of the industry, it's no surprise that Alector's P/S is on the lower end of the spectrum. As other companies in the industry are forecasting revenue growth, Alector's poor outlook justifies its low P/S ratio. Unless there's material change, it's hard to envision a situation where the stock price will rise drastically.
Before you take the next step, you should know about the 3 warning signs for Alector (1 is a bit unpleasant!) that we have uncovered.
If companies with solid past earnings growth is up your alley, you may wish to see this free collection of other companies with strong earnings growth and low P/E ratios.
Have feedback on this article? Concerned about the content? Get in touch with us directly. Alternatively, email editorial-team (at) simplywallst.com.
This article by Simply Wall St is general in nature. We provide commentary based on historical data and analyst forecasts only using an unbiased methodology and our articles are not intended to be financial advice. It does not constitute a recommendation to buy or sell any stock, and does not take account of your objectives, or your financial situation. We aim to bring you long-term focused analysis driven by fundamental data. Note that our analysis may not factor in the latest price-sensitive company announcements or qualitative material. Simply Wall St has no position in any stocks mentioned.
Join A Paid User Research Session
You’ll receive a US$30 Amazon Gift card for 1 hour of your time while helping us build better investing tools for the individual investors like yourself. Sign up here
