
 Yahoo Finance
 Here’s What The Berkeley Group Holdings plc’s (LON:BKG) Return On Capital Can Tell Us

Today we'll evaluate The Berkeley Group Holdings plc (LON:BKG) to determine whether it could have potential as an investment idea. Specifically, we'll consider its Return On Capital Employed (ROCE), since that will give us an insight into how efficiently the business can generate profits from the capital it requires.
First up, we'll look at what ROCE is and how we calculate it. Second, we'll look at its ROCE compared to similar companies. And finally, we'll look at how its current liabilities are impacting its ROCE.
Understanding Return On Capital Employed (ROCE)
ROCE measures the amount of pre-tax profits a company can generate from the capital employed in its business. In general, businesses with a higher ROCE are usually better quality. In brief, it is a useful tool, but it is not without drawbacks. Author Edwin Whiting says to be careful when comparing the ROCE of different businesses, since 'No two businesses are exactly alike.
So, How Do We Calculate ROCE?
The formula for calculating the return on capital employed is:
Return on Capital Employed = Earnings Before Interest and Tax (EBIT) ÷ (Total Assets - Current Liabilities)
Or for Berkeley Group Holdings:
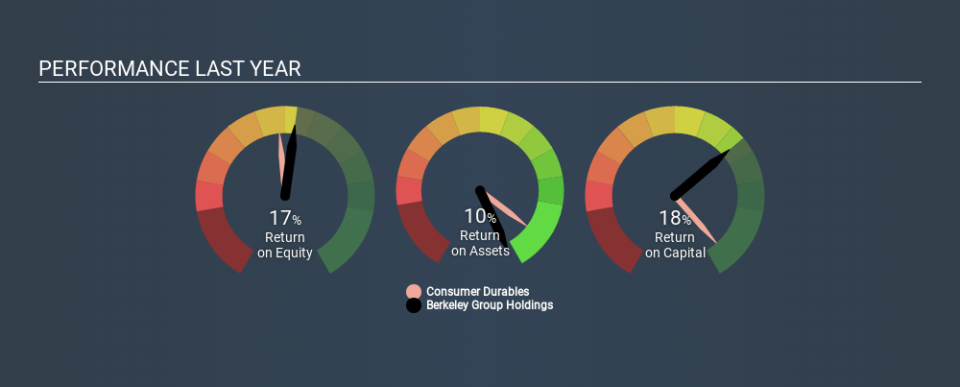
0.18 = UK£623m ÷ (UK£5.1b - UK£1.6b) (Based on the trailing twelve months to October 2019.)
So, Berkeley Group Holdings has an ROCE of 18%.
View our latest analysis for Berkeley Group Holdings
Is Berkeley Group Holdings's ROCE Good?
One way to assess ROCE is to compare similar companies. Using our data, Berkeley Group Holdings's ROCE appears to be around the 16% average of the Consumer Durables industry. Separate from Berkeley Group Holdings's performance relative to its industry, its ROCE in absolute terms looks satisfactory, and it may be worth researching in more depth.
We can see that, Berkeley Group Holdings currently has an ROCE of 18%, less than the 29% it reported 3 years ago. Therefore we wonder if the company is facing new headwinds. You can see in the image below how Berkeley Group Holdings's ROCE compares to its industry. Click to see more on past growth.
When considering ROCE, bear in mind that it reflects the past and does not necessarily predict the future. ROCE can be deceptive for cyclical businesses, as returns can look incredible in boom times, and terribly low in downturns. ROCE is only a point-in-time measure. Future performance is what matters, and you can see analyst predictions in our free report on analyst forecasts for the company.
What Are Current Liabilities, And How Do They Affect Berkeley Group Holdings's ROCE?
Current liabilities are short term bills and invoices that need to be paid in 12 months or less. Due to the way ROCE is calculated, a high level of current liabilities makes a company look as though it has less capital employed, and thus can (sometimes unfairly) boost the ROCE. To check the impact of this, we calculate if a company has high current liabilities relative to its total assets.
Berkeley Group Holdings has total liabilities of UK£1.6b and total assets of UK£5.1b. Therefore its current liabilities are equivalent to approximately 32% of its total assets. Berkeley Group Holdings has a middling amount of current liabilities, increasing its ROCE somewhat.
The Bottom Line On Berkeley Group Holdings's ROCE
Berkeley Group Holdings's ROCE does look good, but the level of current liabilities also contribute to that. There might be better investments than Berkeley Group Holdings out there, but you will have to work hard to find them . These promising businesses with rapidly growing earnings might be right up your alley.
I will like Berkeley Group Holdings better if I see some big insider buys. While we wait, check out this free list of growing companies with considerable, recent, insider buying.
If you spot an error that warrants correction, please contact the editor at editorial-team@simplywallst.com. This article by Simply Wall St is general in nature. It does not constitute a recommendation to buy or sell any stock, and does not take account of your objectives, or your financial situation. Simply Wall St has no position in the stocks mentioned.
We aim to bring you long-term focused research analysis driven by fundamental data. Note that our analysis may not factor in the latest price-sensitive company announcements or qualitative material. Thank you for reading.
