
 Yahoo Finance
 BILL Holdings, Inc.'s (NYSE:BILL) Price In Tune With Revenues
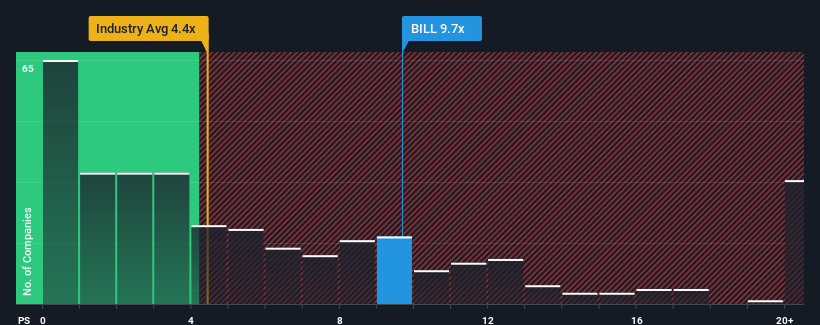
BILL Holdings, Inc.'s (NYSE:BILL) price-to-sales (or "P/S") ratio of 9.7x might make it look like a strong sell right now compared to the Software industry in the United States, where around half of the companies have P/S ratios below 4.4x and even P/S below 2x are quite common. Nonetheless, we'd need to dig a little deeper to determine if there is a rational basis for the highly elevated P/S.
View our latest analysis for BILL Holdings
How BILL Holdings Has Been Performing
With revenue growth that's superior to most other companies of late, BILL Holdings has been doing relatively well. It seems that many are expecting the strong revenue performance to persist, which has raised the P/S. However, if this isn't the case, investors might get caught out paying to much for the stock.
If you'd like to see what analysts are forecasting going forward, you should check out our free report on BILL Holdings.
Is There Enough Revenue Growth Forecasted For BILL Holdings?
There's an inherent assumption that a company should far outperform the industry for P/S ratios like BILL Holdings' to be considered reasonable.
If we review the last year of revenue growth, the company posted a terrific increase of 108%. This great performance means it was also able to deliver immense revenue growth over the last three years. So we can start by confirming that the company has done a tremendous job of growing revenue over that time.
Looking ahead now, revenue is anticipated to climb by 27% per year during the coming three years according to the analysts following the company. With the industry only predicted to deliver 13% per year, the company is positioned for a stronger revenue result.
With this in mind, it's not hard to understand why BILL Holdings' P/S is high relative to its industry peers. Apparently shareholders aren't keen to offload something that is potentially eyeing a more prosperous future.
The Final Word
Generally, our preference is to limit the use of the price-to-sales ratio to establishing what the market thinks about the overall health of a company.
As we suspected, our examination of BILL Holdings' analyst forecasts revealed that its superior revenue outlook is contributing to its high P/S. At this stage investors feel the potential for a deterioration in revenues is quite remote, justifying the elevated P/S ratio. It's hard to see the share price falling strongly in the near future under these circumstances.
Plus, you should also learn about these 4 warning signs we've spotted with BILL Holdings.
If you're unsure about the strength of BILL Holdings' business, why not explore our interactive list of stocks with solid business fundamentals for some other companies you may have missed.
Have feedback on this article? Concerned about the content? Get in touch with us directly. Alternatively, email editorial-team (at) simplywallst.com.
This article by Simply Wall St is general in nature. We provide commentary based on historical data and analyst forecasts only using an unbiased methodology and our articles are not intended to be financial advice. It does not constitute a recommendation to buy or sell any stock, and does not take account of your objectives, or your financial situation. We aim to bring you long-term focused analysis driven by fundamental data. Note that our analysis may not factor in the latest price-sensitive company announcements or qualitative material. Simply Wall St has no position in any stocks mentioned.
Join A Paid User Research Session
You’ll receive a US$30 Amazon Gift card for 1 hour of your time while helping us build better investing tools for the individual investors like yourself. Sign up here
