
 Yahoo Finance
 Bitcoin and ETH Price Prediction: Risk of Bounce Grows, TRX Could Skyrocket
Key Insights:
Bitcoin could rise again unless it breaks the $18,750 support.
Ether (ETH) is showing positive signs above $1,050.
TRX eyes more upsides above the $0.070 resistance.
Bitcoin
After a short-term recovery wave, bitcoin price failed to clear the $20,500 resistance zone. BTC formed a top and started a fresh decline below the $20,000 level.
There was a clear move below the $19,600 support area and the 21 simple moving average (H1). However, the bulls were active near the $18,750 zone. A base was formed and the price corrected above the $19,200 zone and a connecting bearish trend line on the hourly chart.
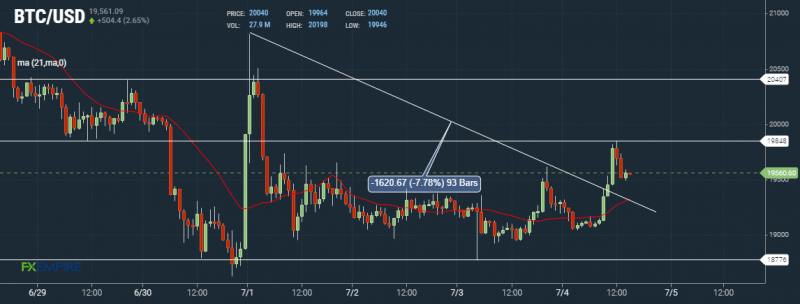
The first major resistance is near the $19,850 level, above which the price could rise towards the $20,500 resistance zone. If not, it might revisit $18,750.
Ethereum (ETH)
ETH is stable above the $1,005 and $1,030 support levels. A base was formed near $1,030 and the price was able to start a recovery wave.
There was a move above the $1,060 resistance zone and the 21 simple moving average (H1). Besides, there is a key bullish trend line forming with support near $1,050 on the hourly chart. On the upside, the price could face sellers near the $1,100 and $1,110 levels.
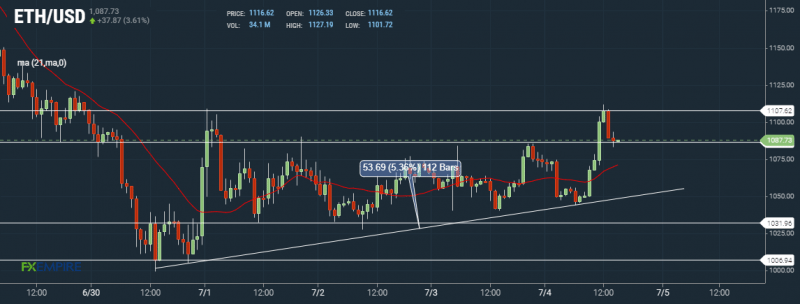
A close above $1,110 could open the doors for a move towards the $1,200 resistance. The next major resistance is now near the $1,250 zone.
Tron (TRX)
TRX found support near the $0.050 level after a strong decline. A strong base was formed above the $0.0500 level and the price started a steady increase.
There was a steady increase above the $0.0560 level. There was a move above the 38.2% Fib retracement level of the downward move from the $0.0900 swing zone to $0.0500 low. TRX price is now trading near a key resistance at $0.0700.
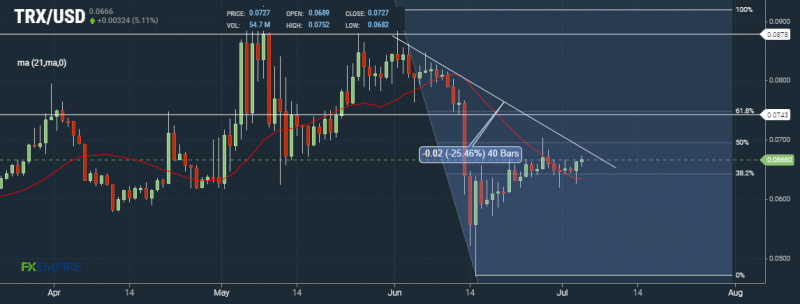
There is a crucial bearish trend line in place with resistance near $0.0700. It is near the 50% Fib retracement level of the downward move from the $0.0900 swing zone to $0.0500 low.
A clear move above the $0.0700 level could send the price towards the $0.0880 resistance zone. If there is no upside break above the $0.0700 resistance, the price could trim gains and restart decline towards the $0.052 support zone.
ADA, BNB, and DOT price
Cardano (ADA) is slowly moving higher and trading above the $0.45 level. The next major resistance sits at $0.472, followed by $0.488.
Binance Coin (BNB) is trading near the $225 level. If there are more gains, the bears might appear near the $235 level.
Polkadot (DOT) is back above the $7.0 resistance level. If the bulls remain in action, the price could test the $7.20 level.
A few trending coins are AVAX, SAND, and UNI. Out of these, UNI is gaining pace above the $4.95 resistance and might surpass $5.0.
This article was originally posted on FX Empire
