
 Yahoo Finance
 Bitcoin and ETH Price Prediction: Short-term Rally, UNI Bulls Eye $6.5
Key Insights:
Bitcoin is slowly moving higher towards the $22,000 resistance.
Ether (ETH) gained over 5% and surpassed $1,160.
UNI is up over 15% and might even rise towards $6.50.
Bitcoin
After forming a base above the $19,000 level, bitcoin price started an upside correction. There was a slow increase above the $20,000 and $20,400 resistance levels.
The price even cleared the $21,000 level and the 21 simple moving average (H1). The current price action is positive above the $21,350 level. On the upside, the price could face resistance near the $22,000 level. Any more gains might send bitcoin to $22,800.

On the downside, there is a major support at $21,000. A daily close below $21,000 could start a major decline.
Ethereum (ETH)
ETH also started a decent recovery wave above the $1,000 resistance level. The price cleared the $1,070 resistance and the 21 simple moving average (H1) to move into a short-term positive zone.
Ether price is now trading above the $1,165 resistance zone. On the upside, there are many hurdles forming near $1,200 and $1,220. A close above the $1,220 level could set the pace for a larger increase.
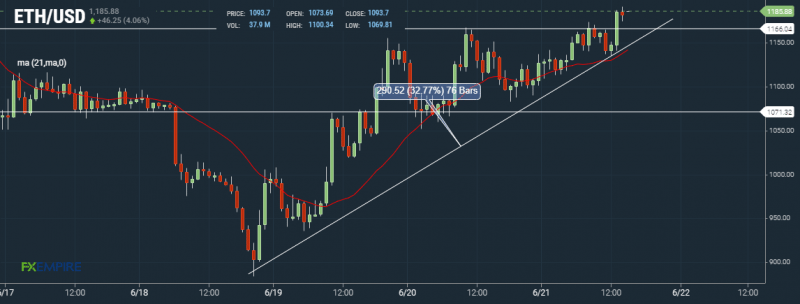
On the downside, there is a key support near the $1,165 level, below which the price could restart decline and test $1,070.
Uniswap (UNI)
UNI started a strong decline after it topped near the $10.00 level. The bears pushed the price below the $8.50 and $5.00 support levels.
It even moved below the $4.20 level and the 21-day simple moving average. Finally, there was a spike below the $3.50 level and the price tested the $3.35 zone. Recently, the price started a recovery wave above the $4.00 resistance.
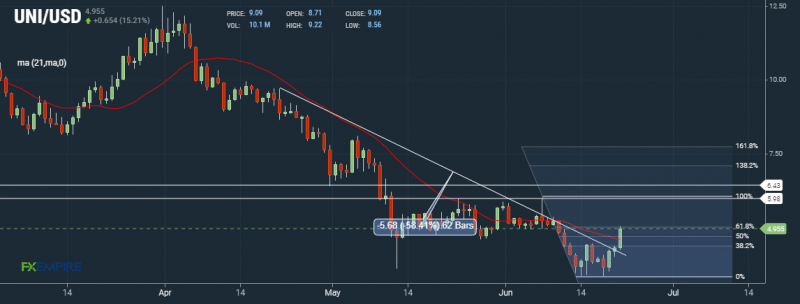
It gained over 15% and was able to clear the 50% Fib retracement level of the downward move from the $6.00 resistance zone to $3.35 low. UNI also cleared a major bearish trend line at $4.20 on the daily chart.
The next major resistance is near the $5.00 level. A close above the $5.00 level could start a major increase towards the $6.50 resistance zone in the near term. If there is no upside break, the price could restart decline and test the $4.00 level.
ADA, BNB, and DOT price
Cardano (ADA) cleared the $0.500 resistance zone. The next major resistance is near $0.520, above which it could rise towards $0.532.
BNB is gaining pace towards the $230 and $235 resistance levels. A clear move above $235 might call for a test of the $250 resistance.
Polkadot (DOT) broke the $8.0 resistance level. If the bulls remain in action, the price could rise towards the $8.80 resistance zone.
A few trending coins are DOGE, MATIC, and SHIB. Out of these, DOGE is attempting an upside break above the $0.070 resistance.
This article was originally posted on FX Empire
More From FXEMPIRE:
Election officials detail threats by Trump supporters at Jan. 6 Capitol riot hearing
Swimming-Trans athlete Ivy slams FINA policy as ‘unscientific’
Taiwan scrambles 29 jets to warn away Chinese planes in its air defence zone
Fox News parent must face defamation lawsuit over election coverage
Detroit Three automakers to make masking optional at all U.S. plants
Texas official calls police response to Uvalde shooting ‘abject failure’
