
 Yahoo Finance
 Bitcoin Runs In Two Price Channels With Different Time Frame
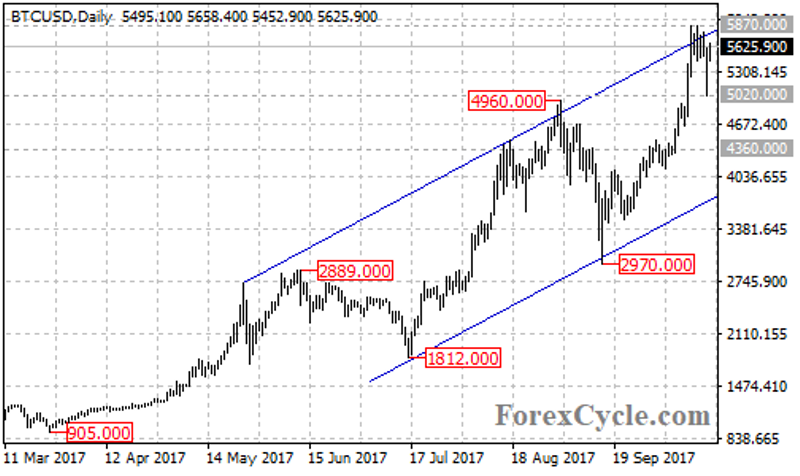
The BTCUSD trades within a rising price channel with support at its bottom around 5110 on the 4-hour chart, indicating that the price remains in the uptrend from 2970. As long as the price is in the channel, the fall from 5870 could be treated as consolidation of the uptrend and a further rise is still possible after the consolidation. The bitcoin price is expected to test 5870 resistance in the coming days. A breakout of this level could trigger further upside movement towards 6500, followed by 7000.
However, the bitcoin price is likely to meet resistance at the top trend line of the price channel on the daily chart and drops sharply to as low as 5020. Now the 5020 is treated as key support of the uptrend from 2970. A breakdown below this level will indicate that the upside movement from 2970 had completed at 5870 already and lengthier consolidation for the longer term uptrend from 905 is underway. Then the following downside movement could bring the price back to next support level at 4360, followed by the bottom trend line of the channel now at around 3750.
Technical levels
Support levels: 5110 (the bottom trend line of the price channel on the 4-hour chart), 5020 (key support), 4360, 3750 (the bottom trend line of the price channel on the daily chart), 2970 (the September 15 low).
Resistance levels: 5870 (the October 13 high), 6500, 7000 (psychological important level).
This article was originally posted on FX Empire
